Slideshow · Travel
The 23 US Airports With the Most Delays, Ranked
Which US airports leave travelers stranded the most?
By Most Viral Today
30 Oct 2026

Which US Airports Leave Travelers Stranded the Most? 
23. Austin-Bergstrom International (AUS) 
22. Tampa International (TPA) 
21. San Diego International (SAN) - AdvertisementSwipe or tap ▶ to continue countdown

20. Phoenix Sky Harbor (PHX) 
19. Seattle-Tacoma International (SEA) 
18. Chicago O'Hare International (ORD) 
17. Philadelphia International (PHL) - AdvertisementSwipe or tap ▶ to continue countdown

16. Hartsfield-Jackson Atlanta (ATL) 
15. Los Angeles International (LAX) 
14. Charlotte Douglas International (CLT) 
13. Houston George Bush Intercontinental (IAH) - AdvertisementSwipe or tap ▶ to continue countdown

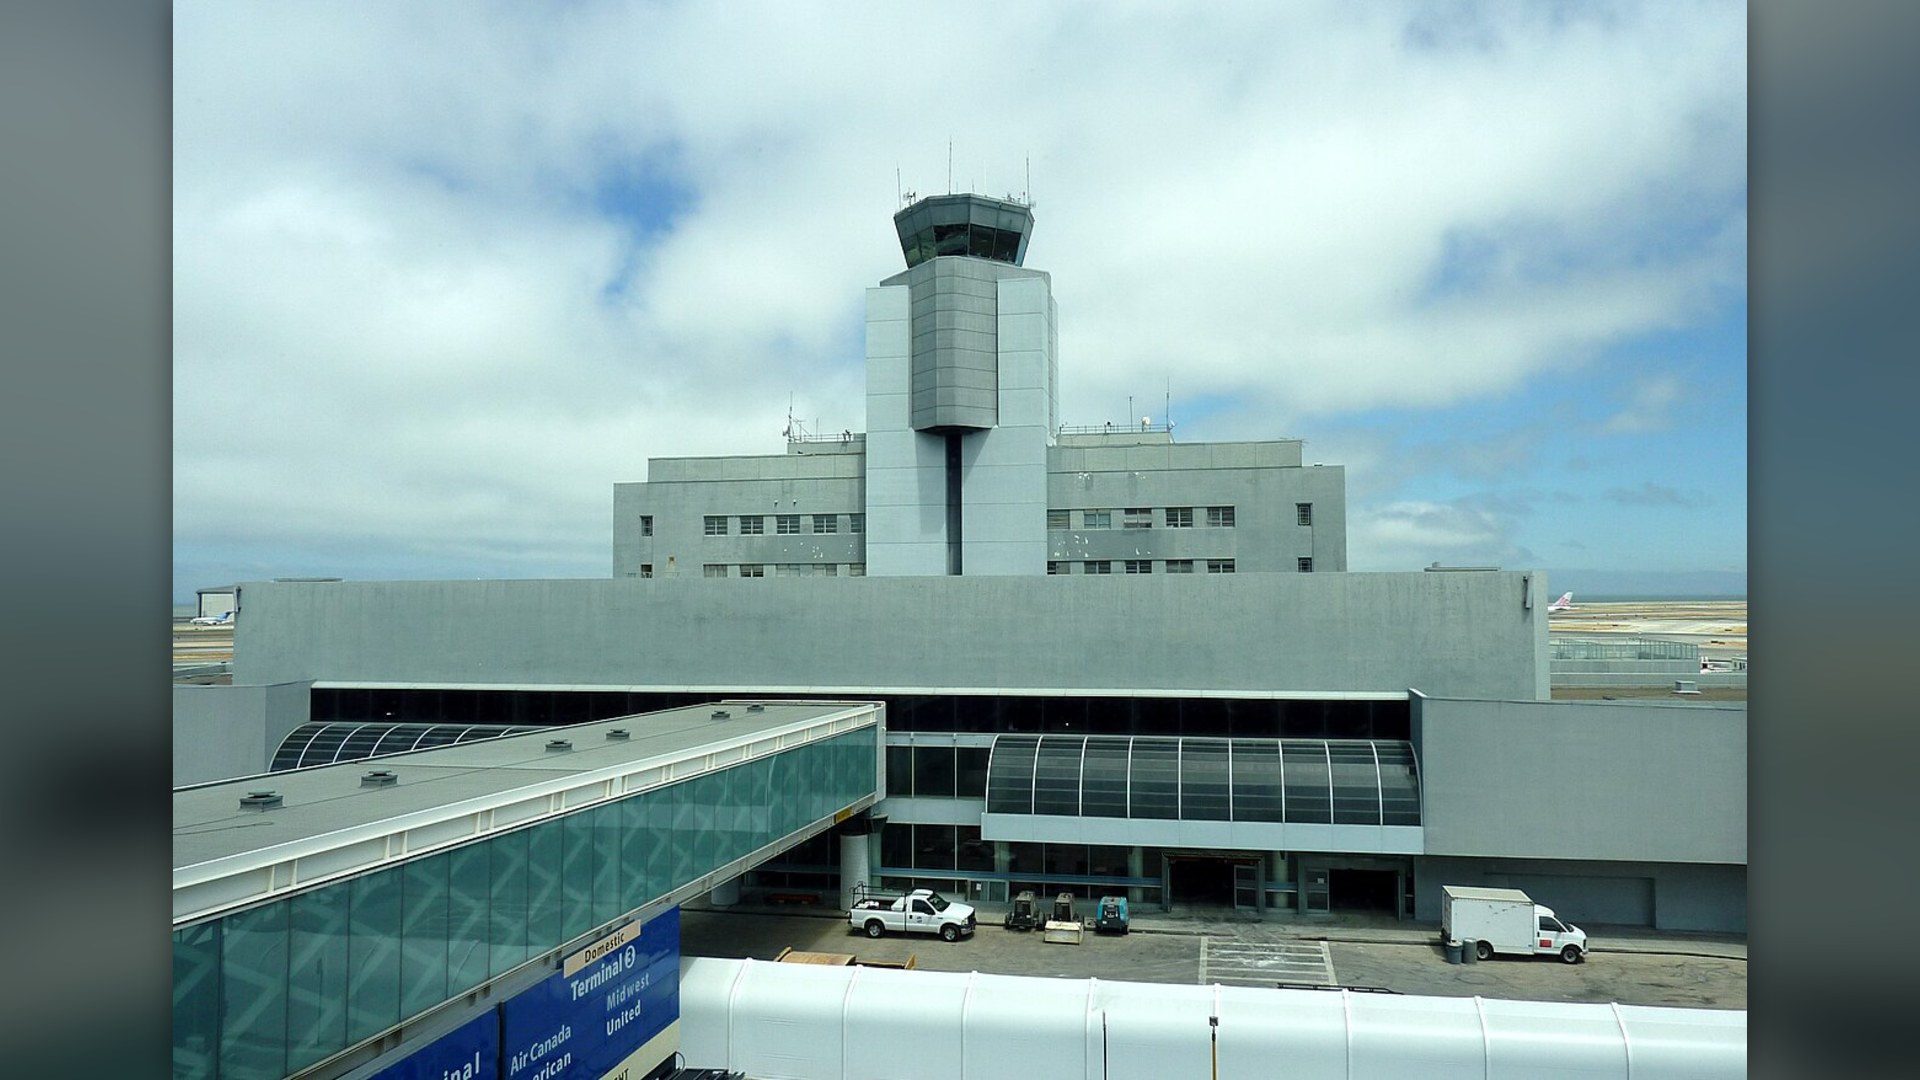
12. San Francisco International (SFO) 
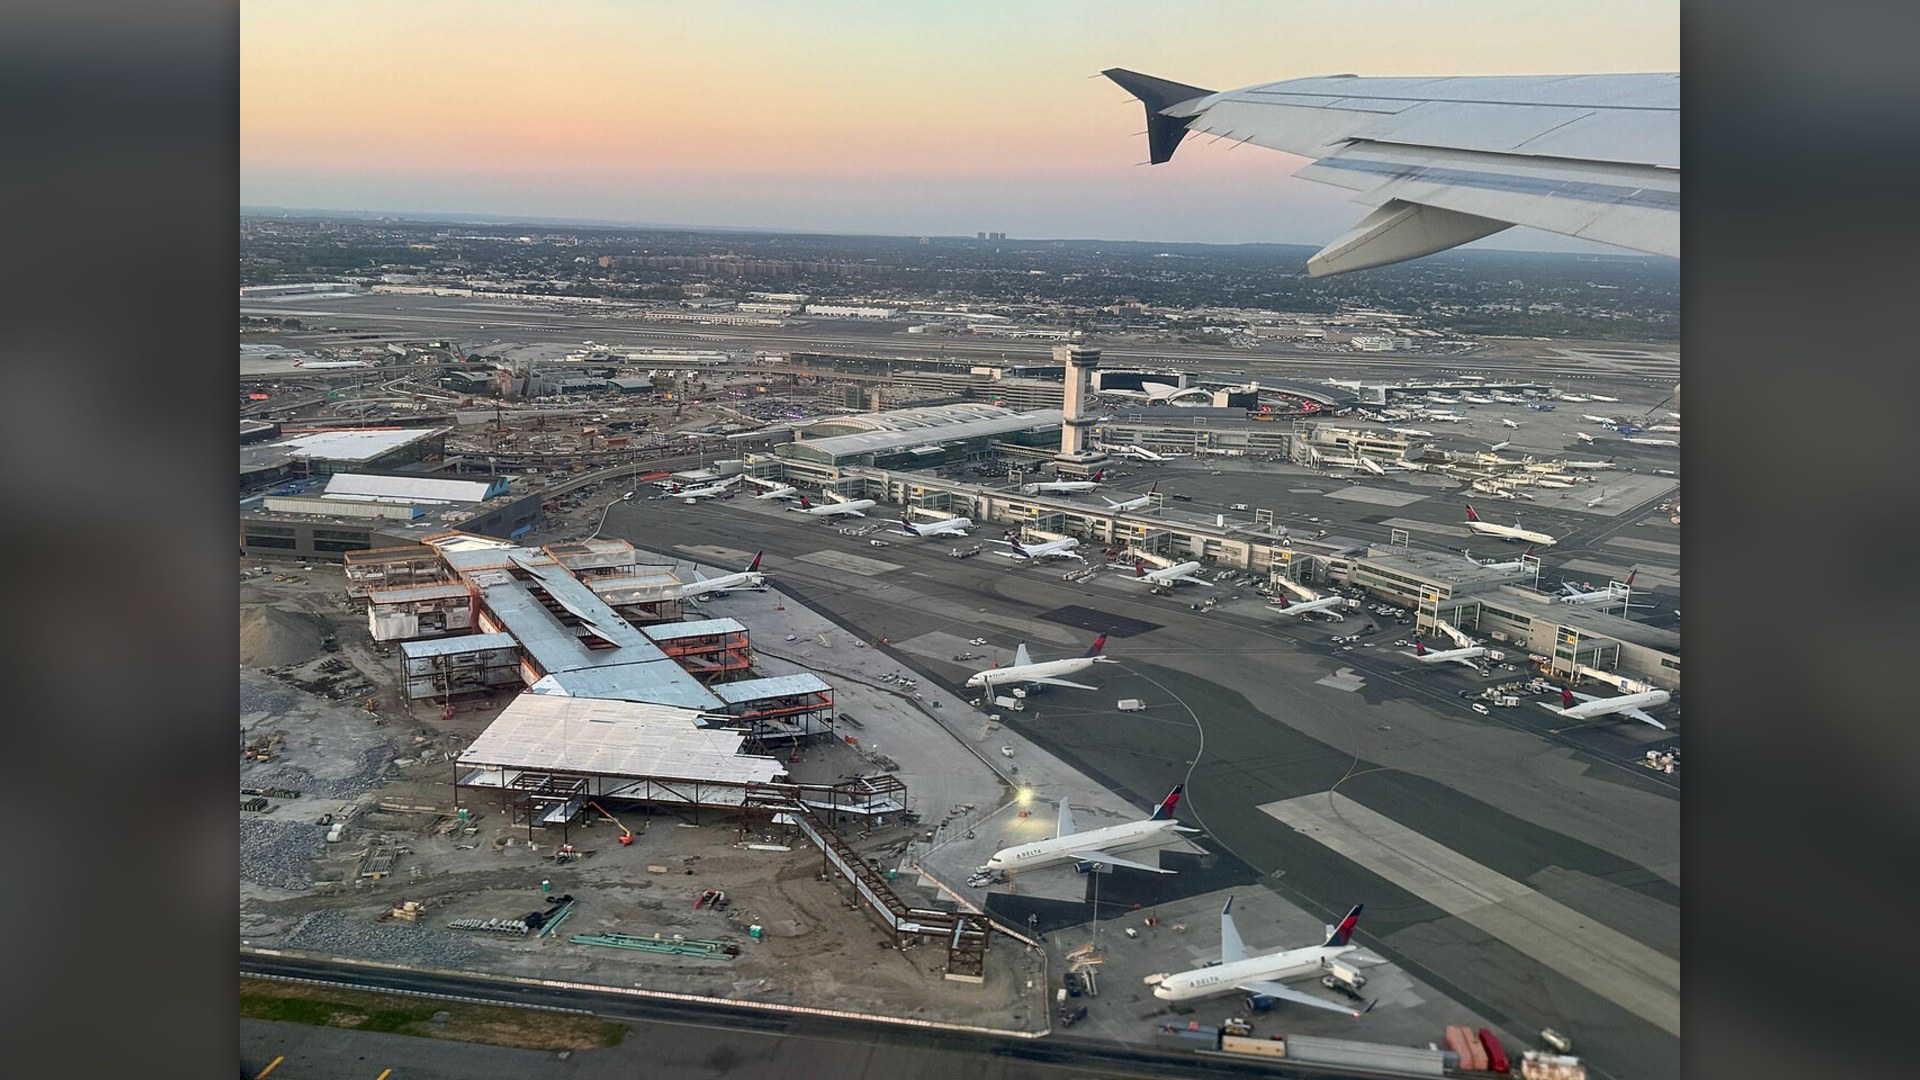
11. John F. Kennedy International (JFK) 
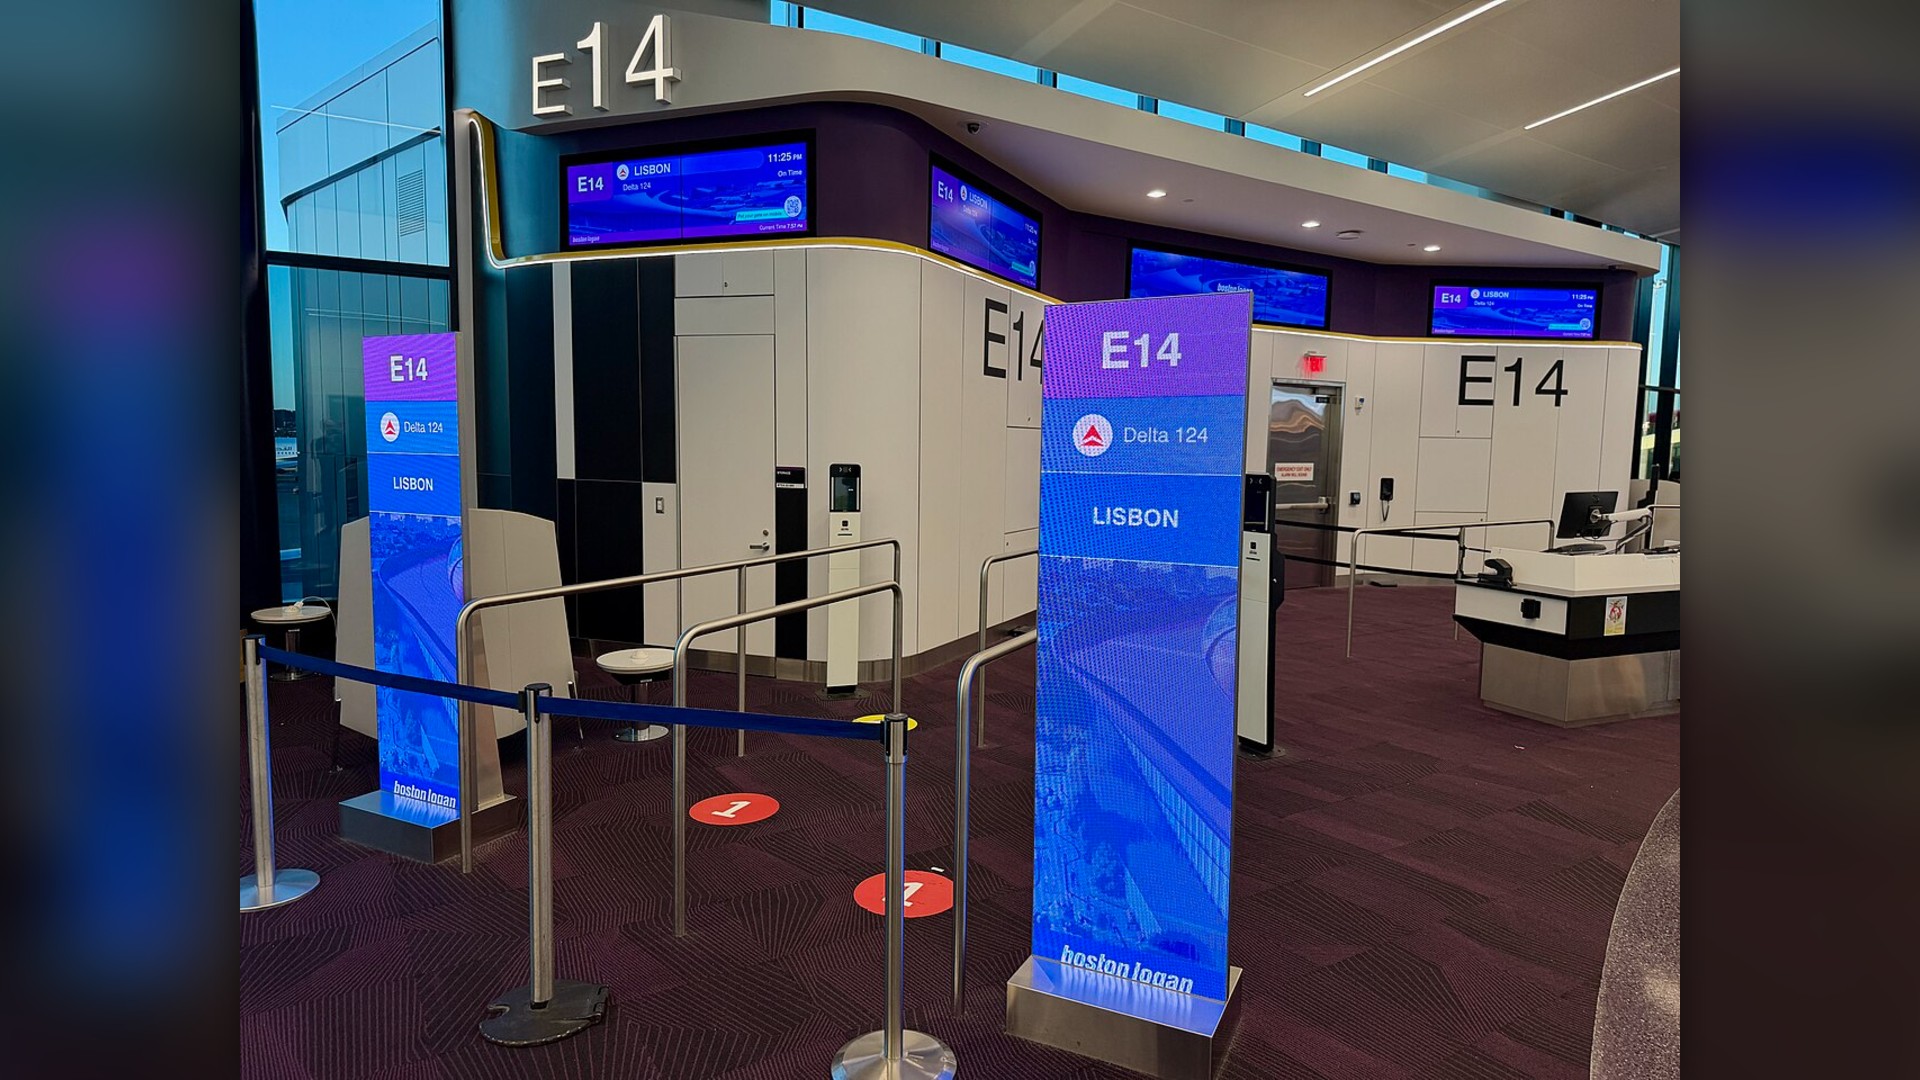
10. Boston Logan International (BOS) 
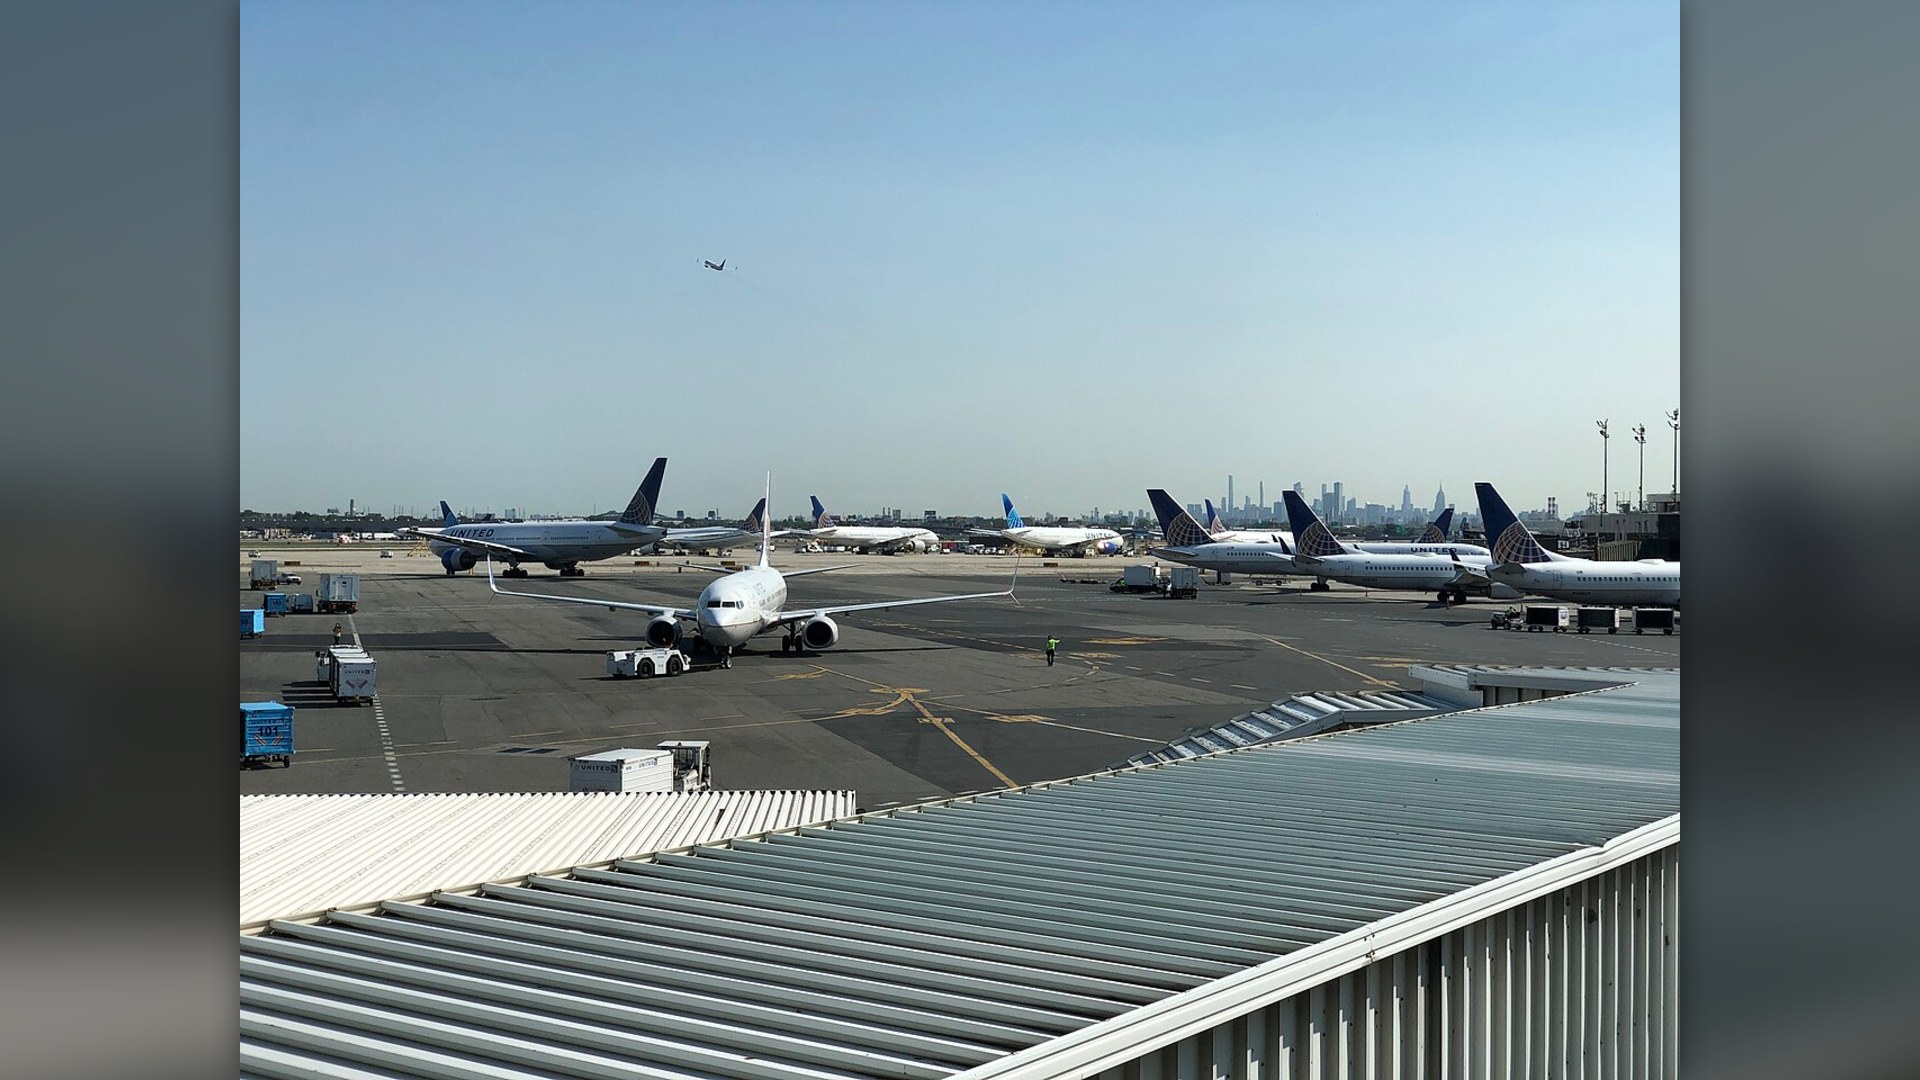
9. Newark Liberty International (EWR) - AdvertisementSwipe or tap ▶ to continue countdown

8. Dallas/Fort Worth International (DFW) 
7. Las Vegas Harry Reid International (LAS) 
6. Miami International (MIA) 
5. Baltimore/Washington International (BWI) - AdvertisementSwipe or tap ▶ to continue countdown

4. Denver International (DEN) 
3. Orlando International (MCO) 
2. Fort Lauderdale-Hollywood (FLL) 
1. Chicago Midway International (MDW) - Advertisement🔥 UP NEXT IN THIS SERIES◫ 26 Slides

25 Most Welcoming US States Ranked by Hospitality
Which American State Truly Treats Strangers Like Family
Drawing on official Bureau of Transportation Statistics records tracking millions of domestic flights, here are the 23 major American airports with the highest percentage of delayed arrivals and tarmac holds, ranked all the way down to number one.
Swipe or tap ▶ to begin the countdown
©Wikimedia / Famartin & wikimedia / Andrew Heneen
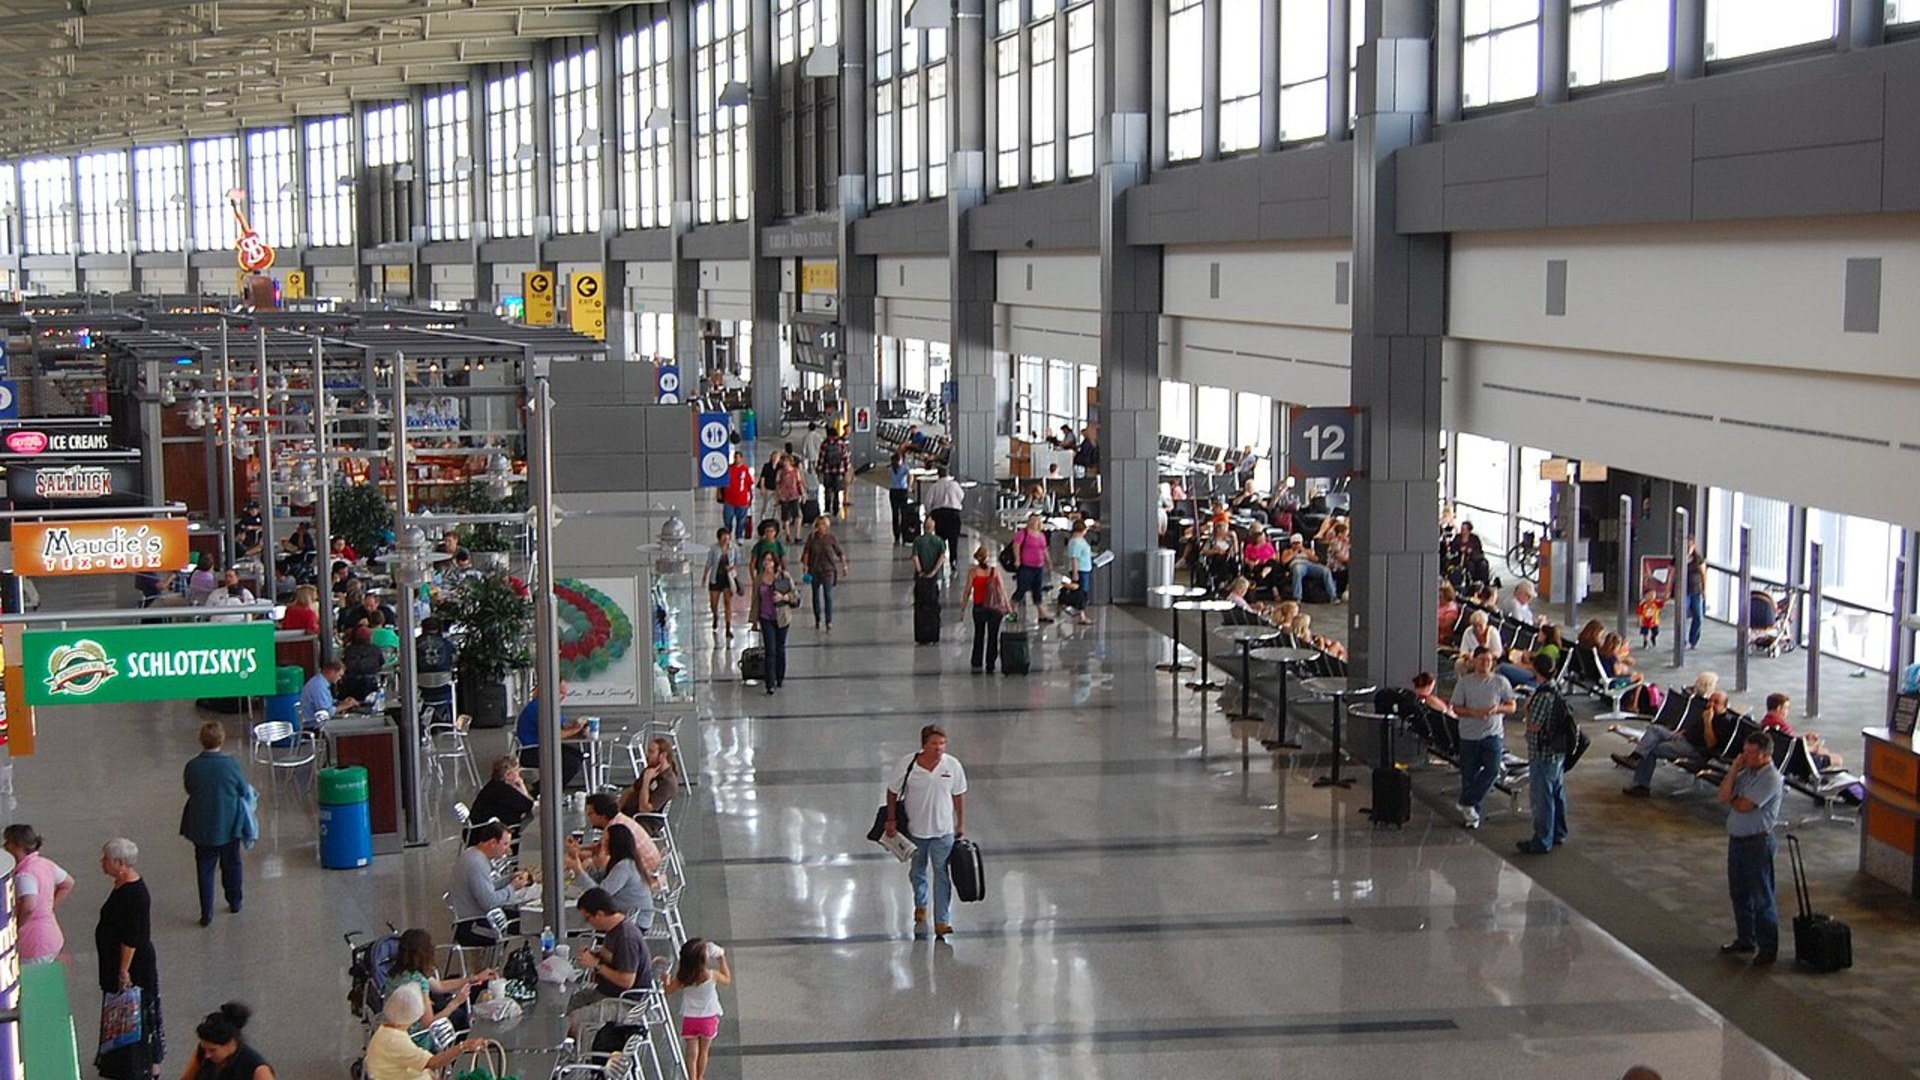
23. Austin-Bergstrom International (AUS)
Surging passenger growth across Texas tech corridors pushed Austin-Bergstrom into heavy runway holds. Recent terminal expansions aim to ease gate bottlenecks, but peak-hour flight surges still leave around 20 percent of travelers waiting on the tarmac.
©Wikimedia Commons / LoneStarMike
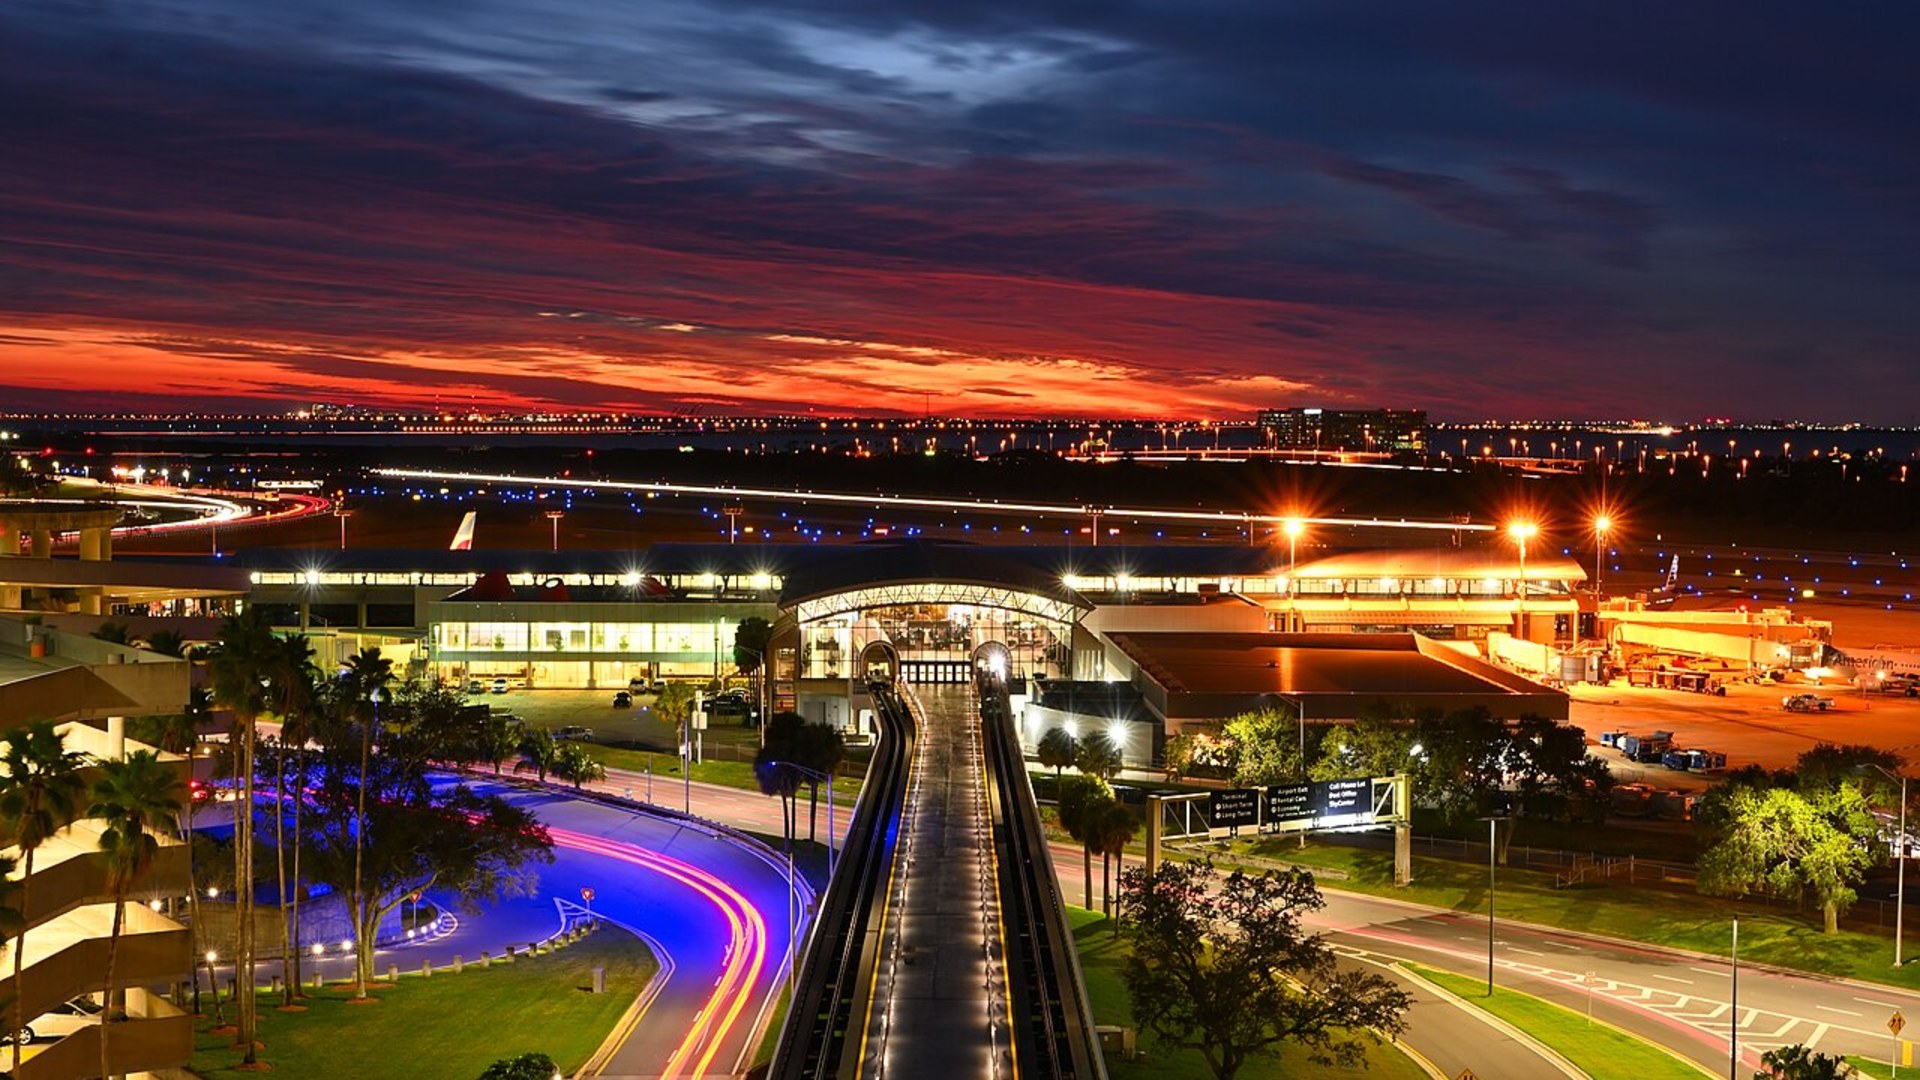
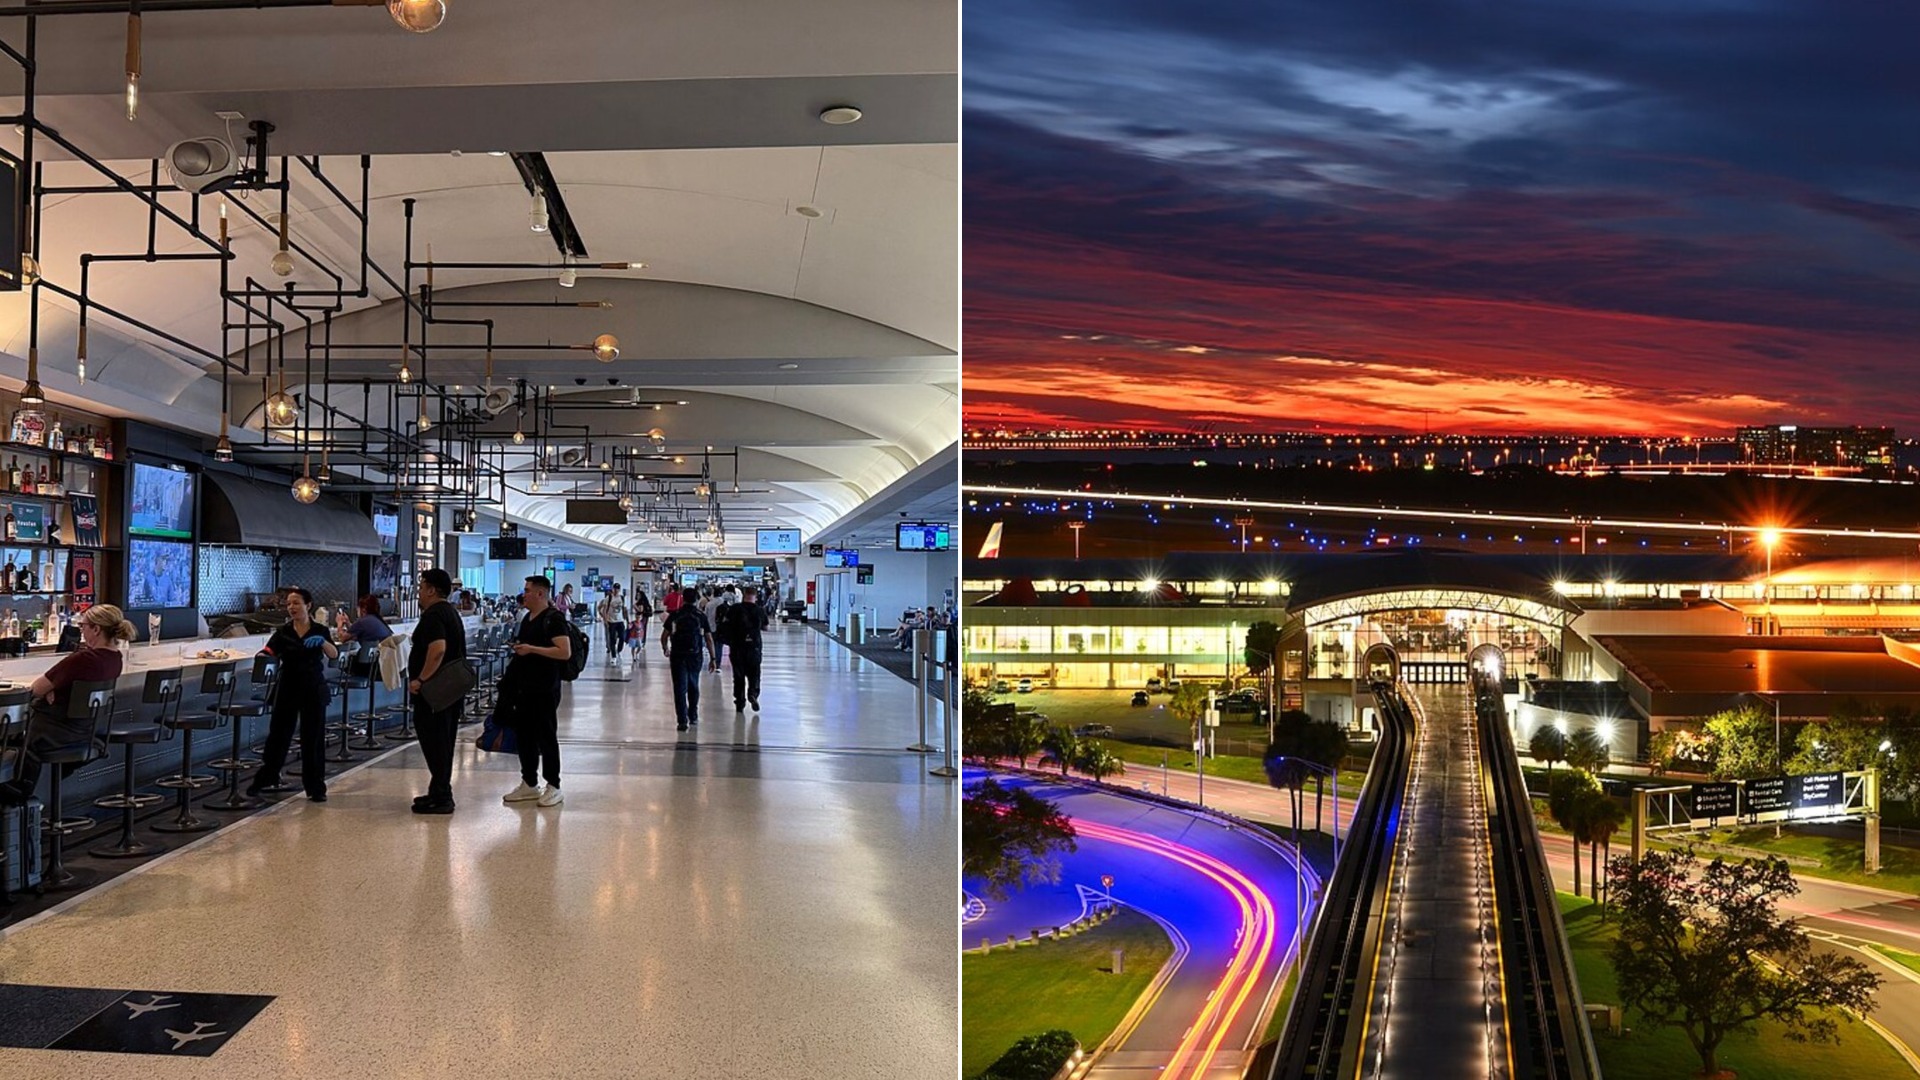
22. Tampa International (TPA)
Tampa boasts one of America's most passenger-friendly terminal designs, but summer weather remains an unavoidable hurdle. Gulf Coast thunderstorm cells frequently force FAA ramp ground stops, impacting roughly 20 percent of afternoon departures.
©Wikimedia Commons / Andrew Heneen
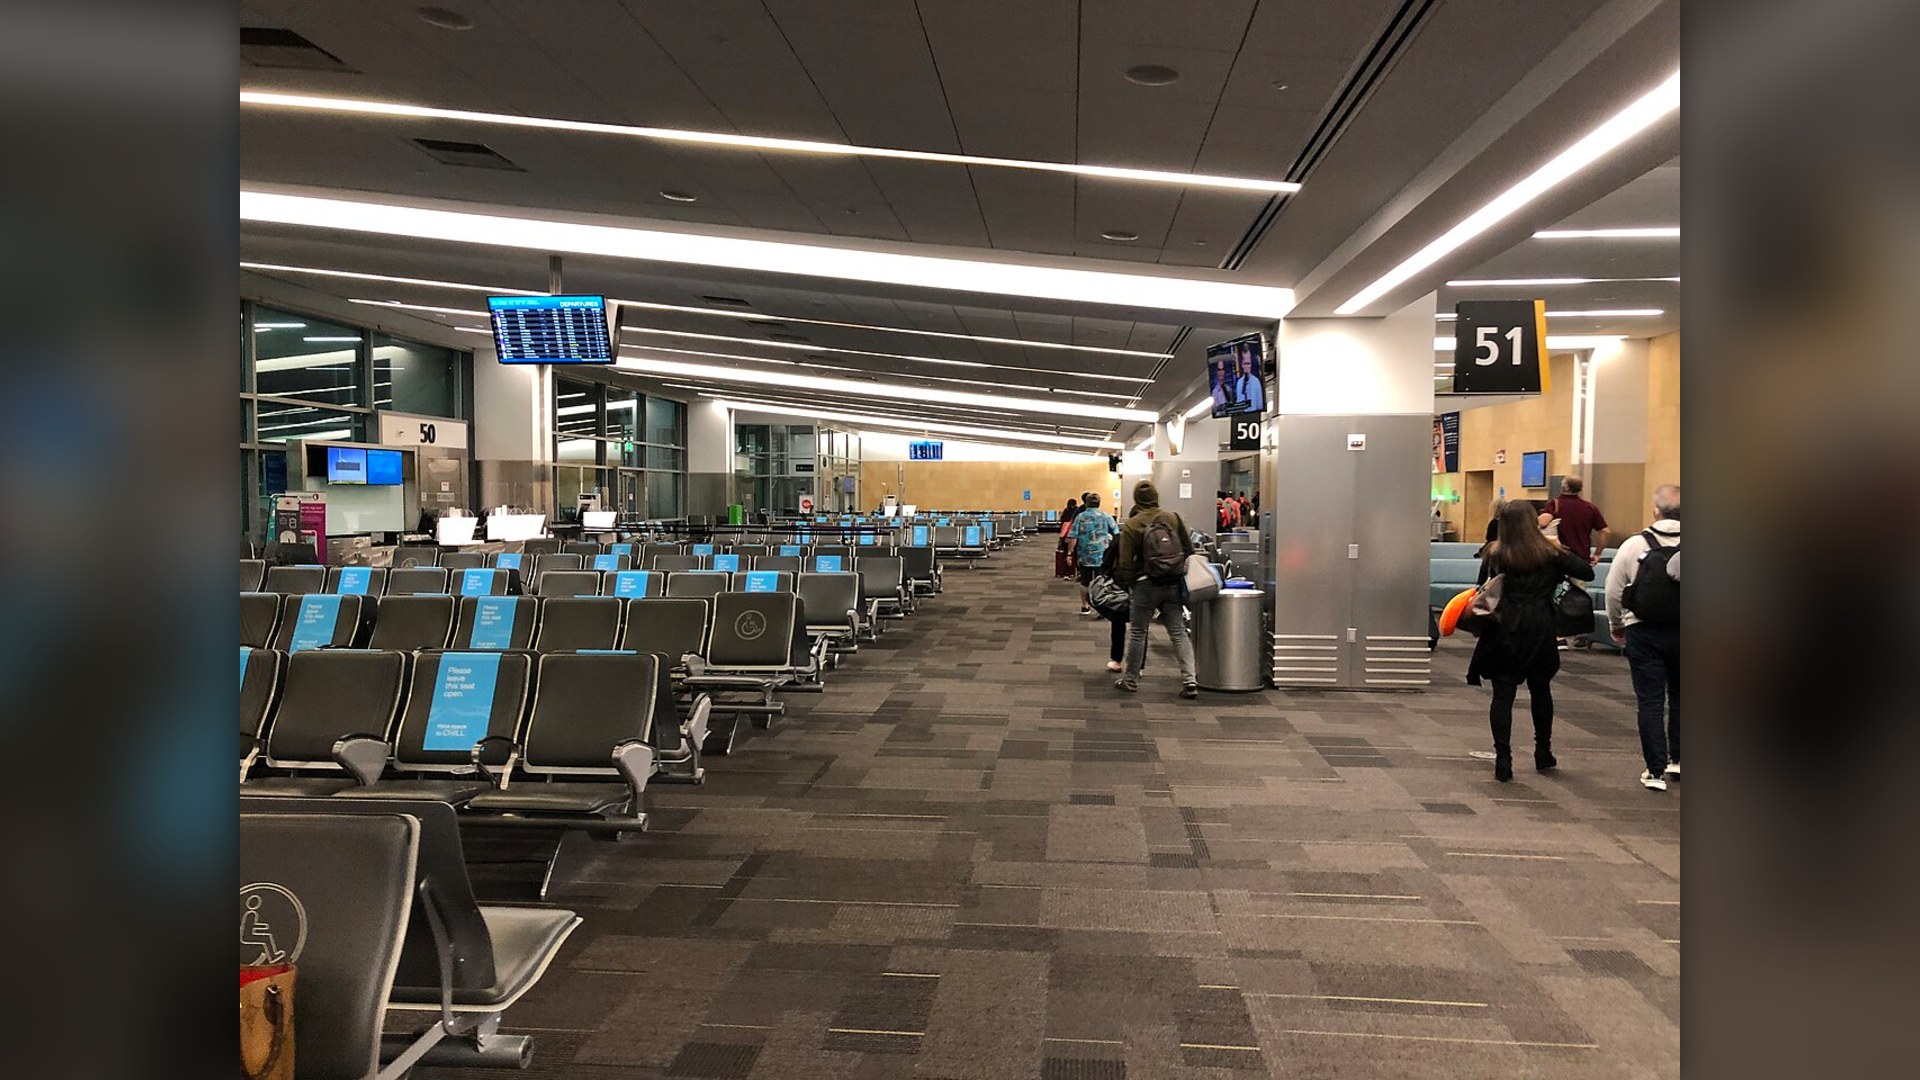
21. San Diego International (SAN)
Operating as the nation's busiest single-runway commercial airfield, San Diego leaves zero room for operational error. Dense arrival sequencing and downtown terrain constraints mean minor morning fog easily ripples into evening schedule delays.
©Wikimedia Commons / Famartin
Advertisement
Swipe or tap ▶ to resume the countdown.
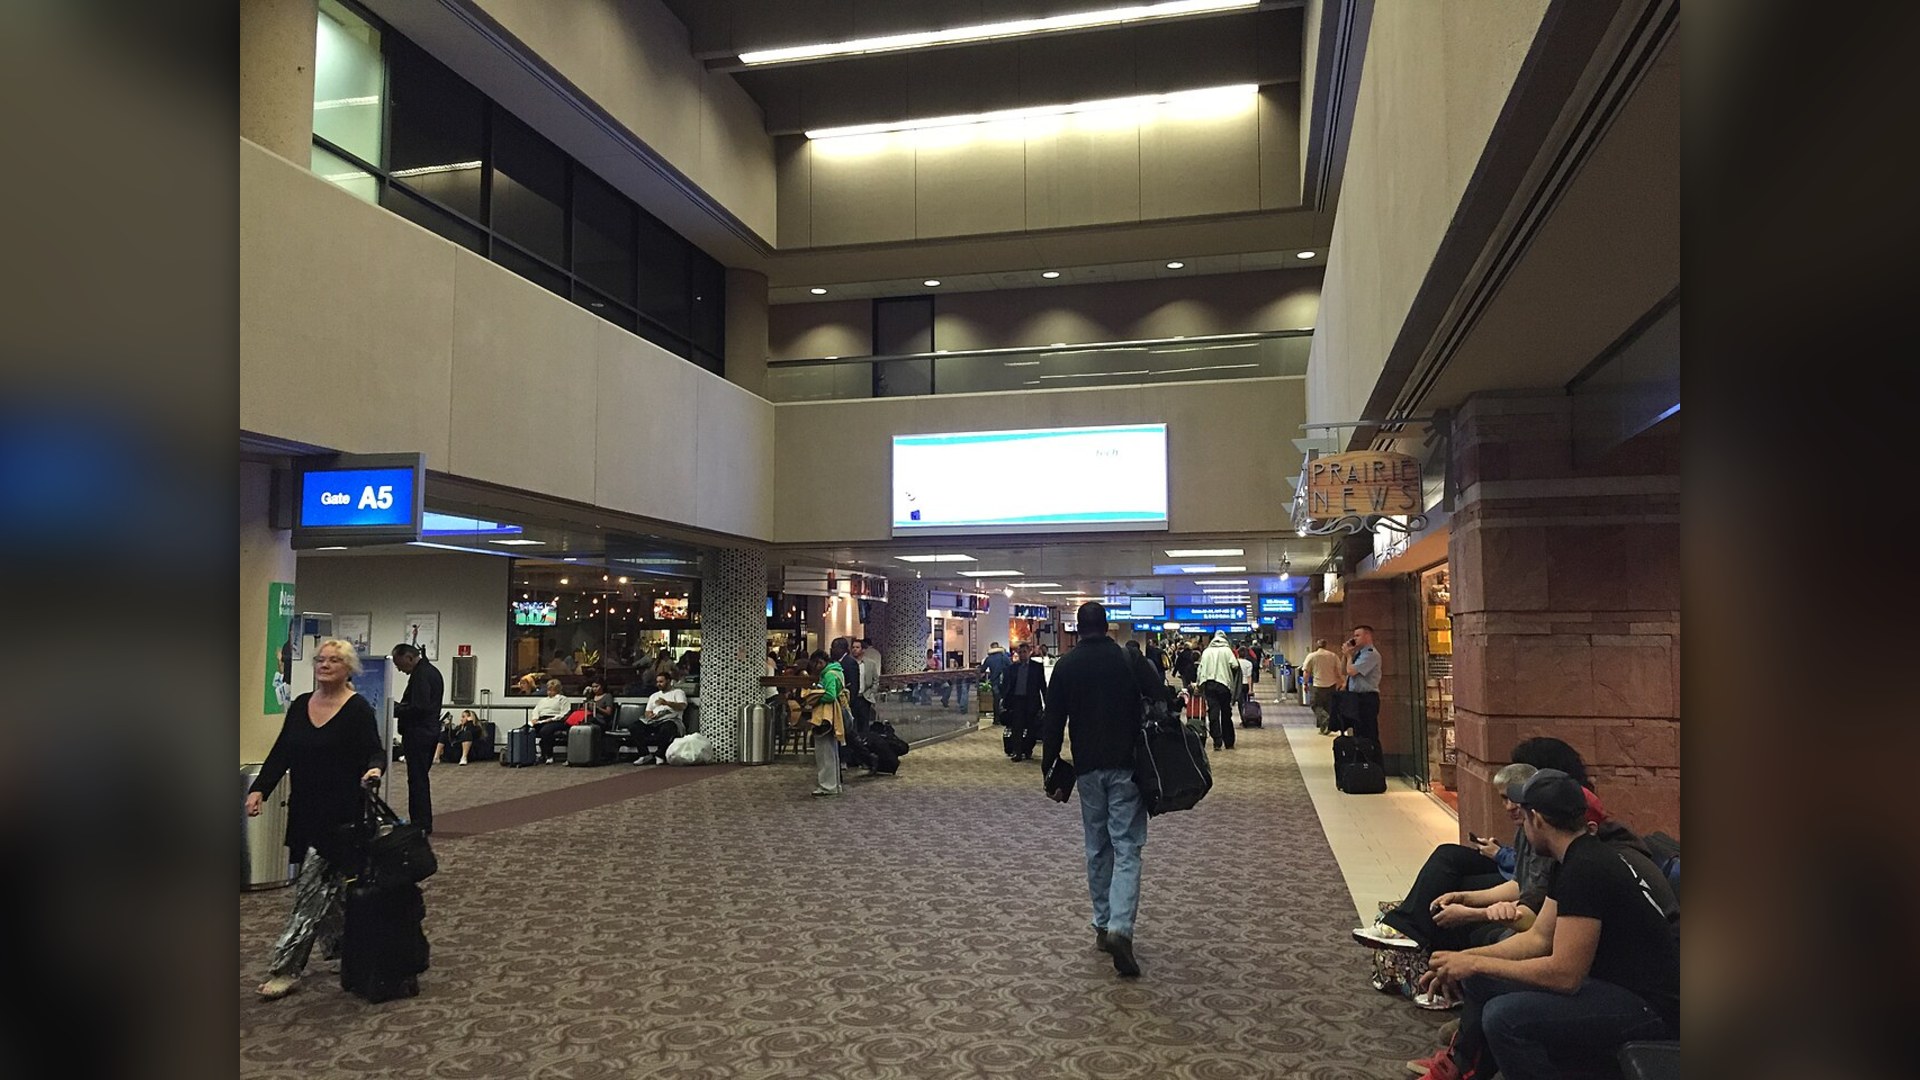
20. Phoenix Sky Harbor (PHX)
Desert heat routinely forces performance weight calculations during summer afternoons when thin air limits jet lift. Combined with busy regional connecting banks, roughly 21 percent of flights experience schedule setbacks.
©Wikimedia Commons / Famartin
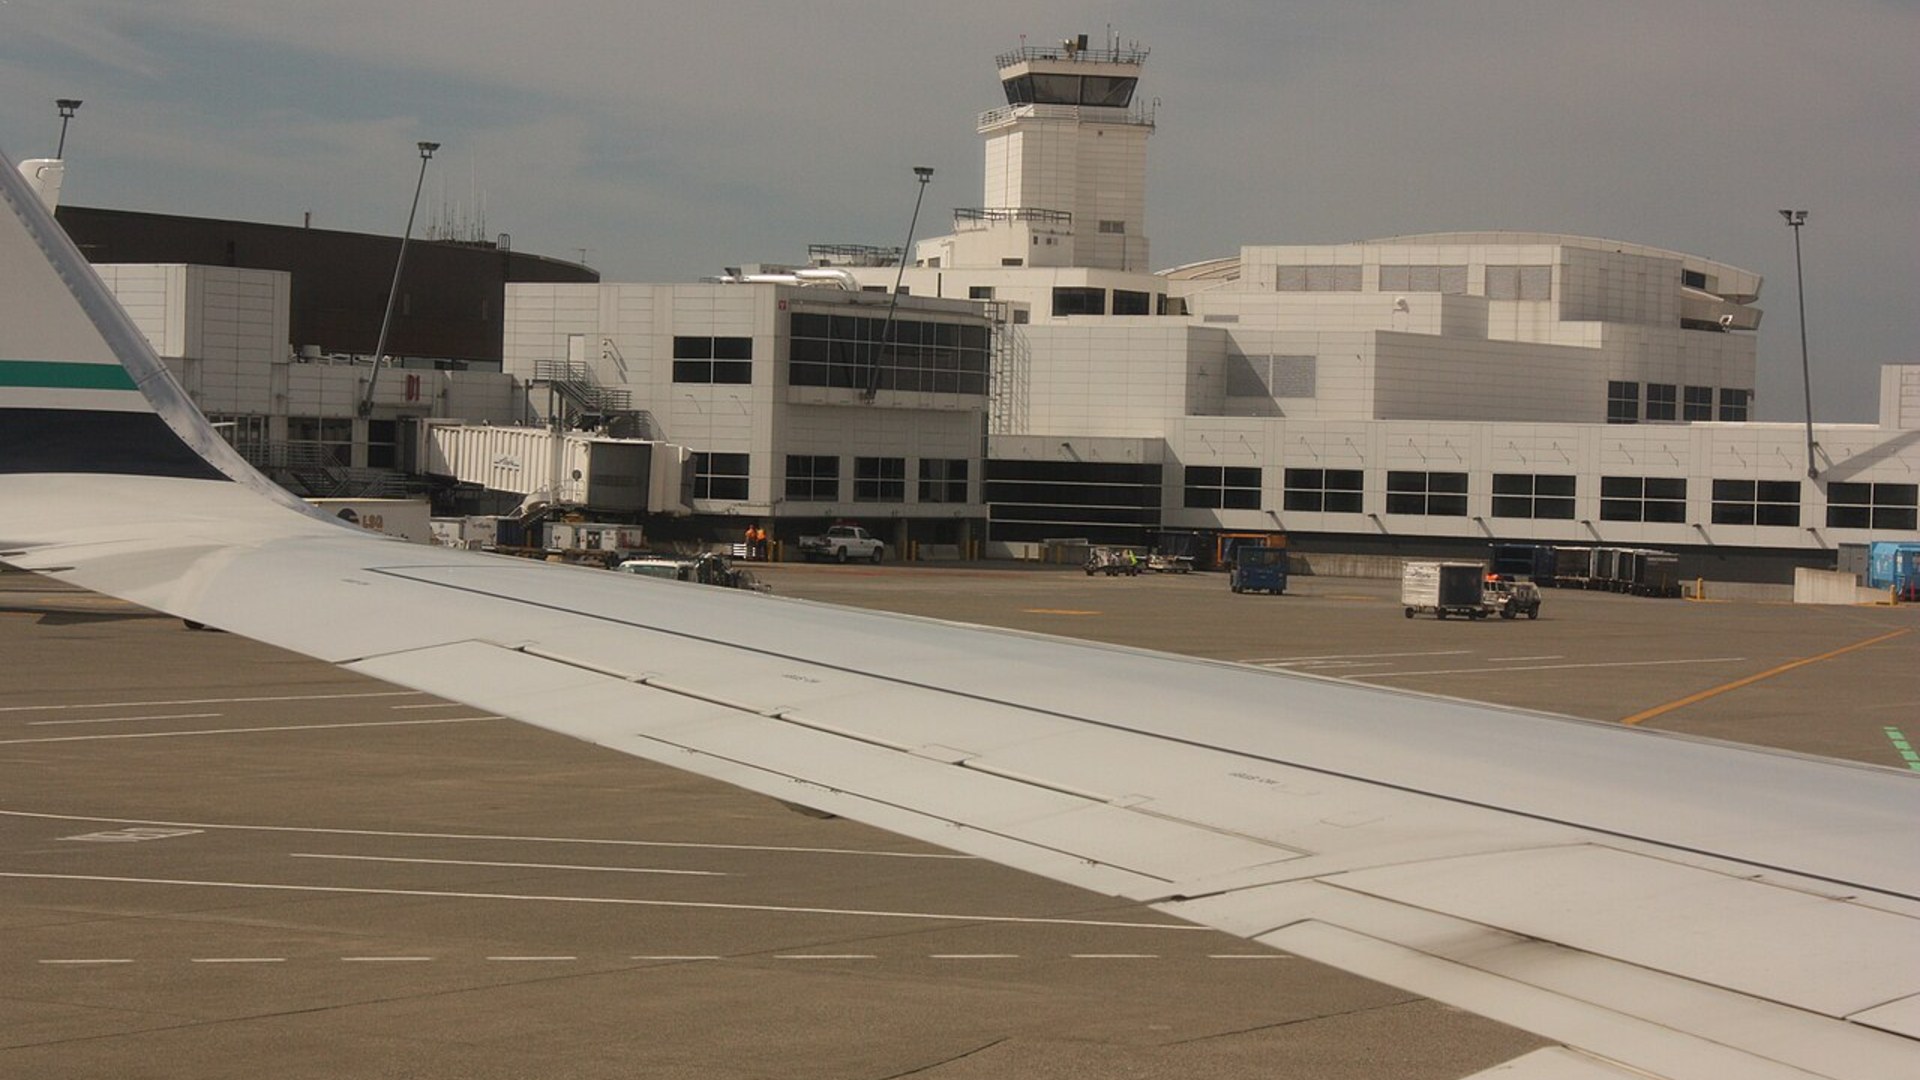
19. Seattle-Tacoma International (SEA)
Squeezed between Puget Sound and the Cascade Mountains, Sea-Tac contends with persistent winter overcast ceilings and crowded taxiways. Growing international traffic creates gate holds that delay over 21 percent of flights.
©Wikimedia Commons / Seattle-Tacoma International Airport
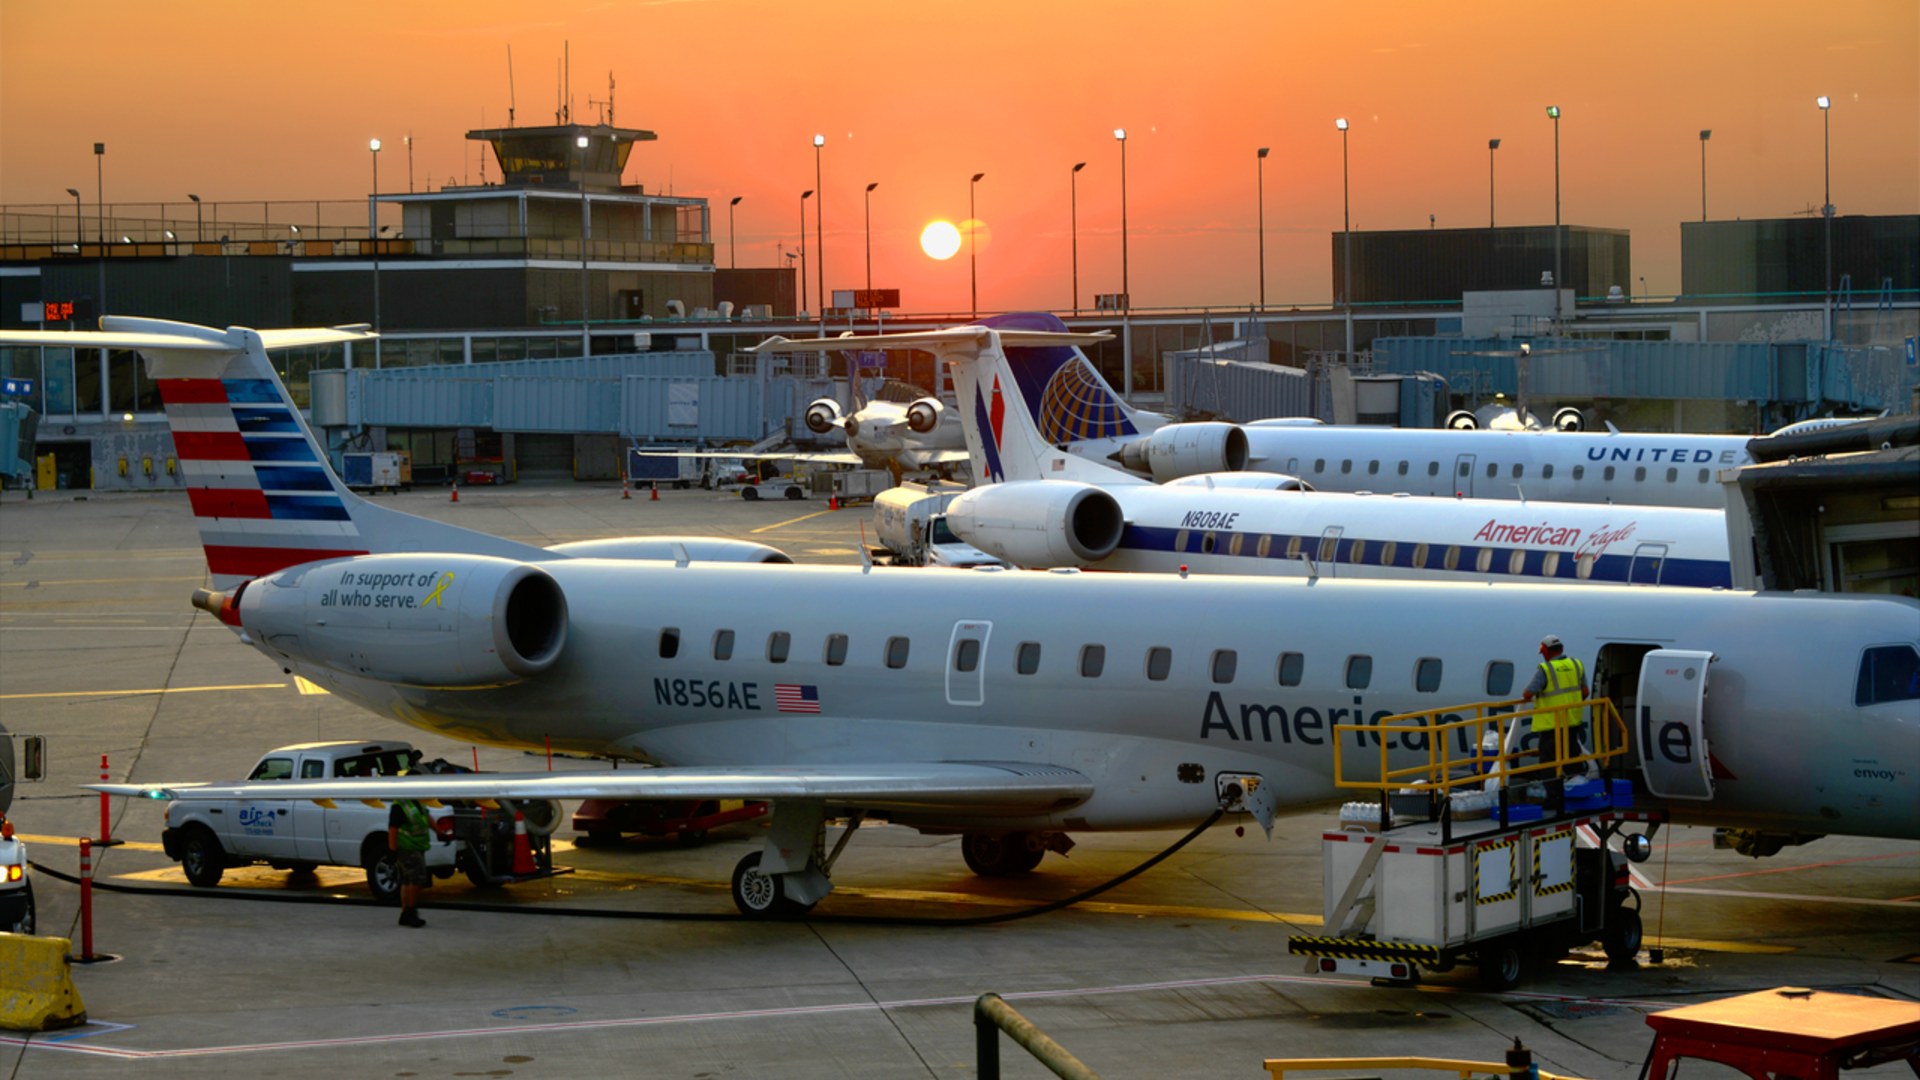
18. Chicago O'Hare International (ORD)
O'Hare modernized its airfield into parallel runways, drastically improving flow, but harsh Lake Michigan snowstorms remain relentless. Extensive winter de-icing queues and severe crosswinds push 22 percent of flights behind schedule.
©Wikimedia Commons / MarcEGottlieb
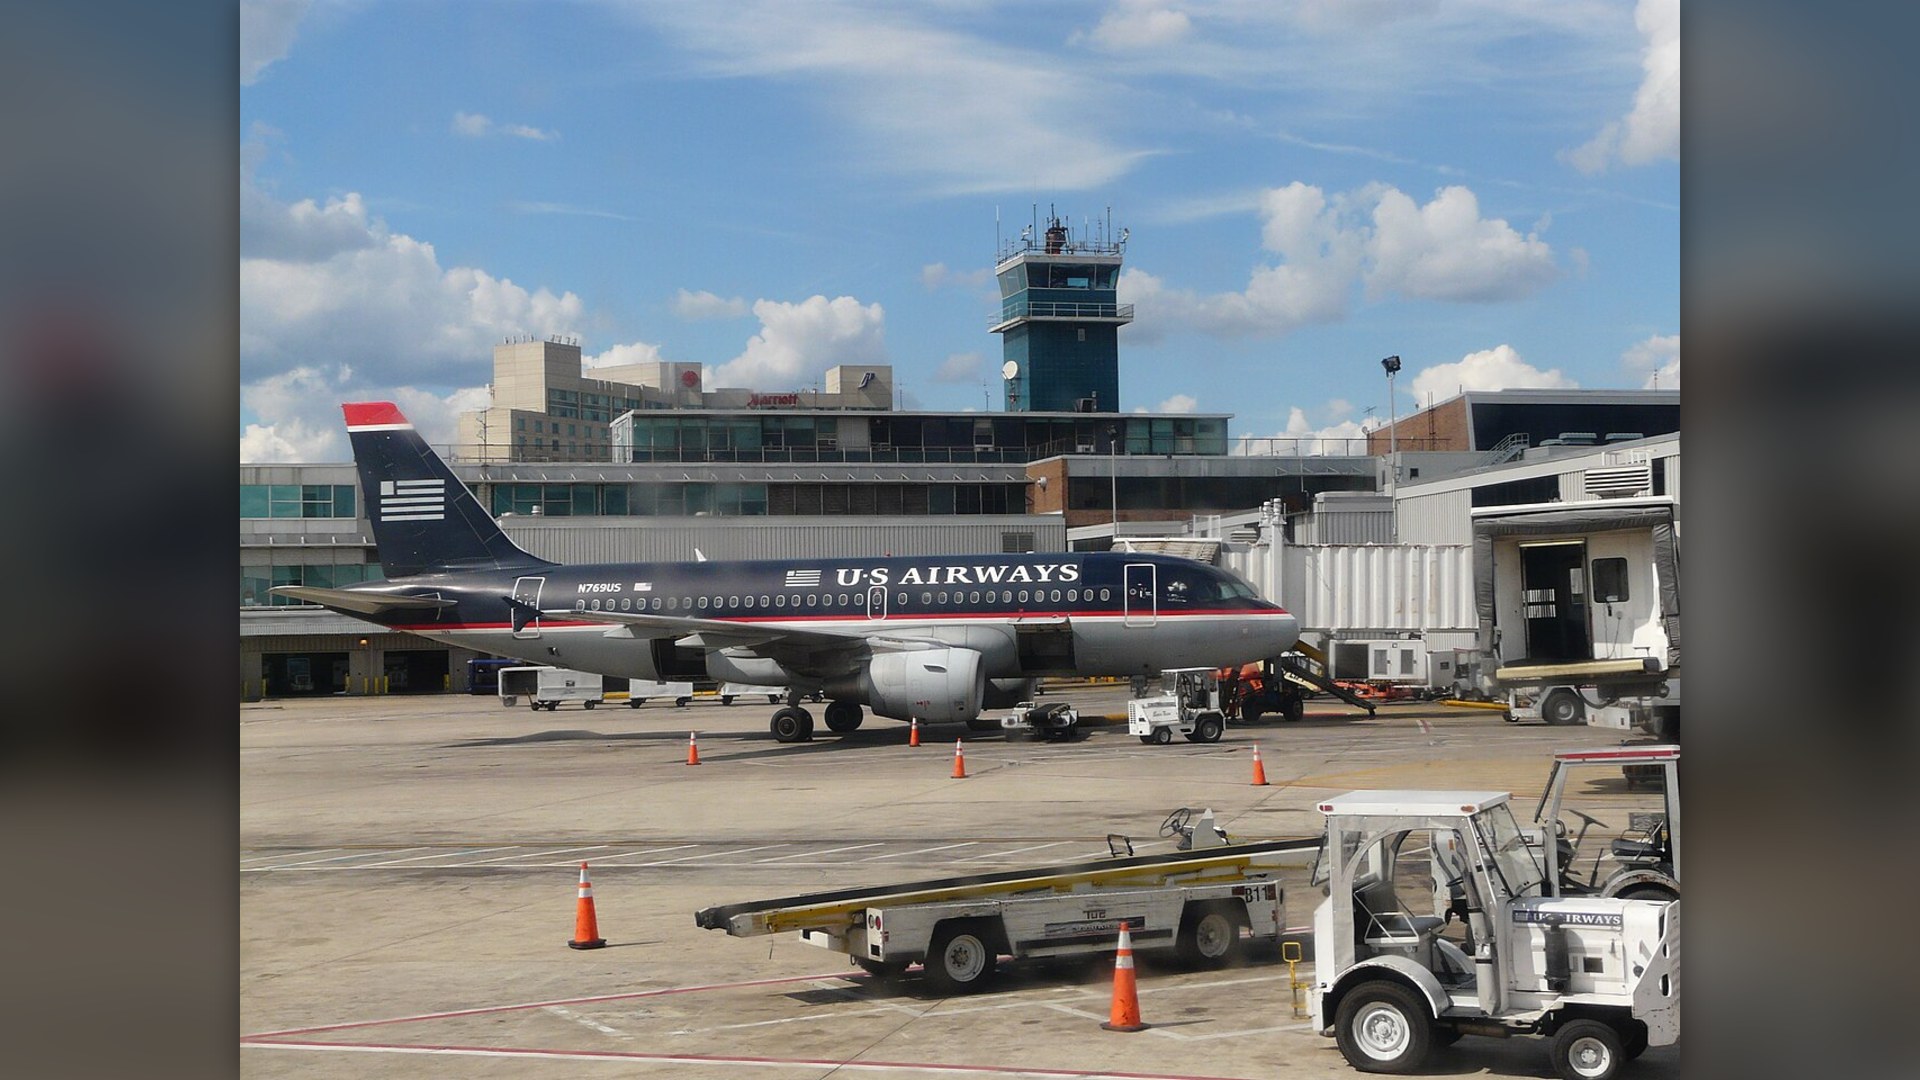
17. Philadelphia International (PHL)
Bordering dense New York and Washington air corridors, Philadelphia aircraft regularly face air traffic control spacing restrictions. Convective summer squalls and winter coastal rain push delay rates above 22 percent.
©Wikimedia Commons / Piotrus
Advertisement
Swipe or tap ▶ to resume the countdown.
16. Hartsfield-Jackson Atlanta (ATL)
Handling over one hundred million passengers annually, Atlanta runs like clockwork until weather hits. Afternoon thunderstorms across the Southeast quickly trigger rolling ground stops across Delta's sprawling multi-concourse fortress hub.
©Wikimedia Commons / Harrison Keely
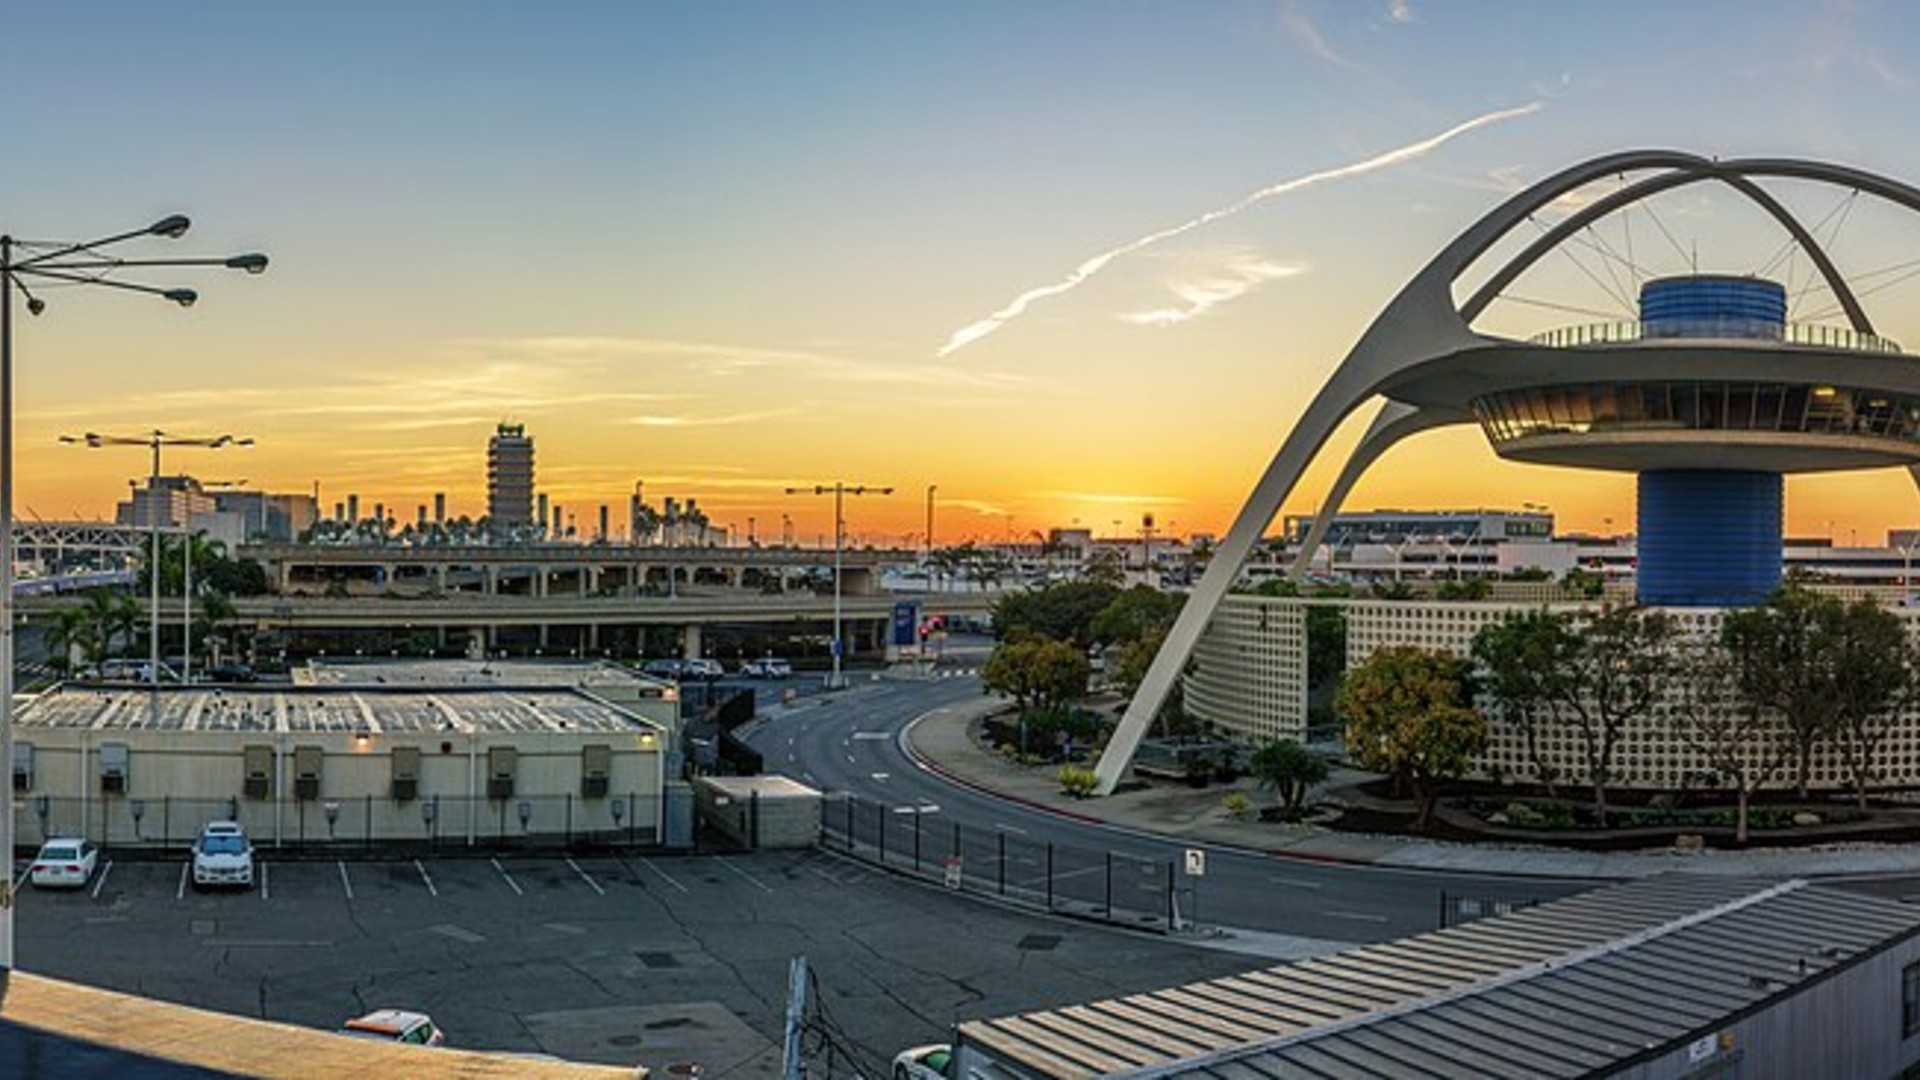
15. Los Angeles International (LAX)
Heavy morning marine fog rolling off the Pacific frequently limits visual approaches to Southern California's primary gateway. Combined with extensive airfield construction and packed gates, nearly 23 percent of flights encounter holds.
©Wikimedia / Jeff Turner from Santa Clarita, CA, United
14. Charlotte Douglas International (CLT)
Charlotte functions as a vital East Coast connecting hub for American Airlines, scheduling massive waves of arriving and departing jets within tight windows. When summer weather sweeps across the Carolinas, delay rates climb past 23 percent.
©Wikimedia Commons / SunDawn
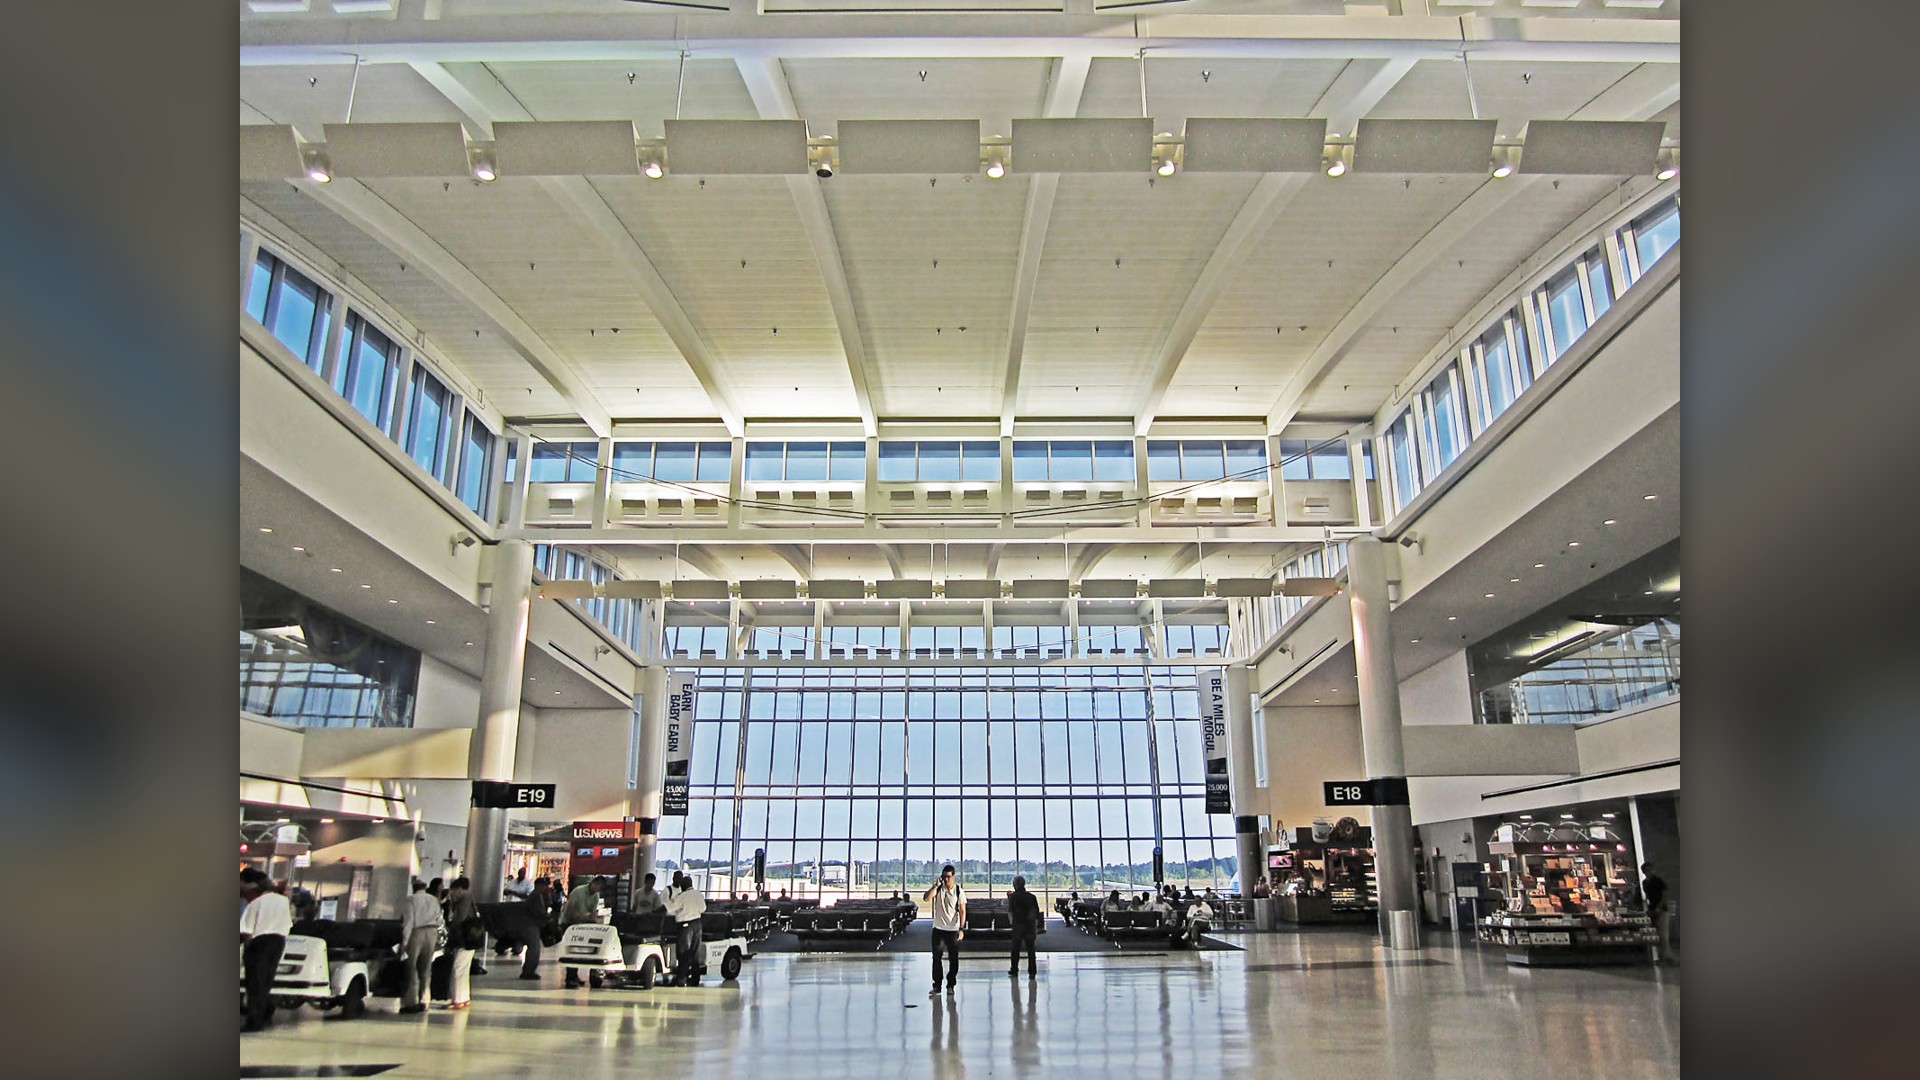
13. Houston George Bush Intercontinental (IAH)
Severe convective squall lines rolling in from the Gulf of Mexico regularly pause ground operations in Houston. Heavy international customs arrival banks and United connection holds push delay rates near 23 percent.
©Wikimedia / Henry Han
Advertisement
Swipe or tap ▶ to resume the countdown.
12. San Francisco International (SFO)
San Francisco's closely spaced parallel runways require clear visual conditions to operate at maximum arrival volume. Whenever thick Pacific fog rolls across the bay, incoming flight capacity drops dramatically, sparking nationwide ripple delays.
©Wikimedia Commons / Bobak Ha'Eri
11. John F. Kennedy International (JFK)
Navigating New York's heavily saturated airspace alongside intense international wide-body scheduling makes JFK vulnerable to ground delays. Passing Atlantic squalls frequently leave 23 percent of passengers waiting on taxiways.
©Wikimedia Commons / Delta Air Lines
10. Boston Logan International (BOS)
Perched along Boston Harbor, Logan airport absorbs the full brunt of Atlantic Nor'easters and freezing ocean winds. Tight runway layouts and congested Northeast air corridors lead to delays on nearly 24 percent of flights.
©Wikimedia / Oleg Yunakov
9. Newark Liberty International (EWR)
Sharing airspace with JFK and LaGuardia leaves Newark with zero room for weather disruptions. Air traffic control staffing constraints and runway congestion regularly push delay numbers above 24 percent.
©Wikimedia Commons / Famartin
Advertisement
Swipe or tap ▶ to resume the countdown.
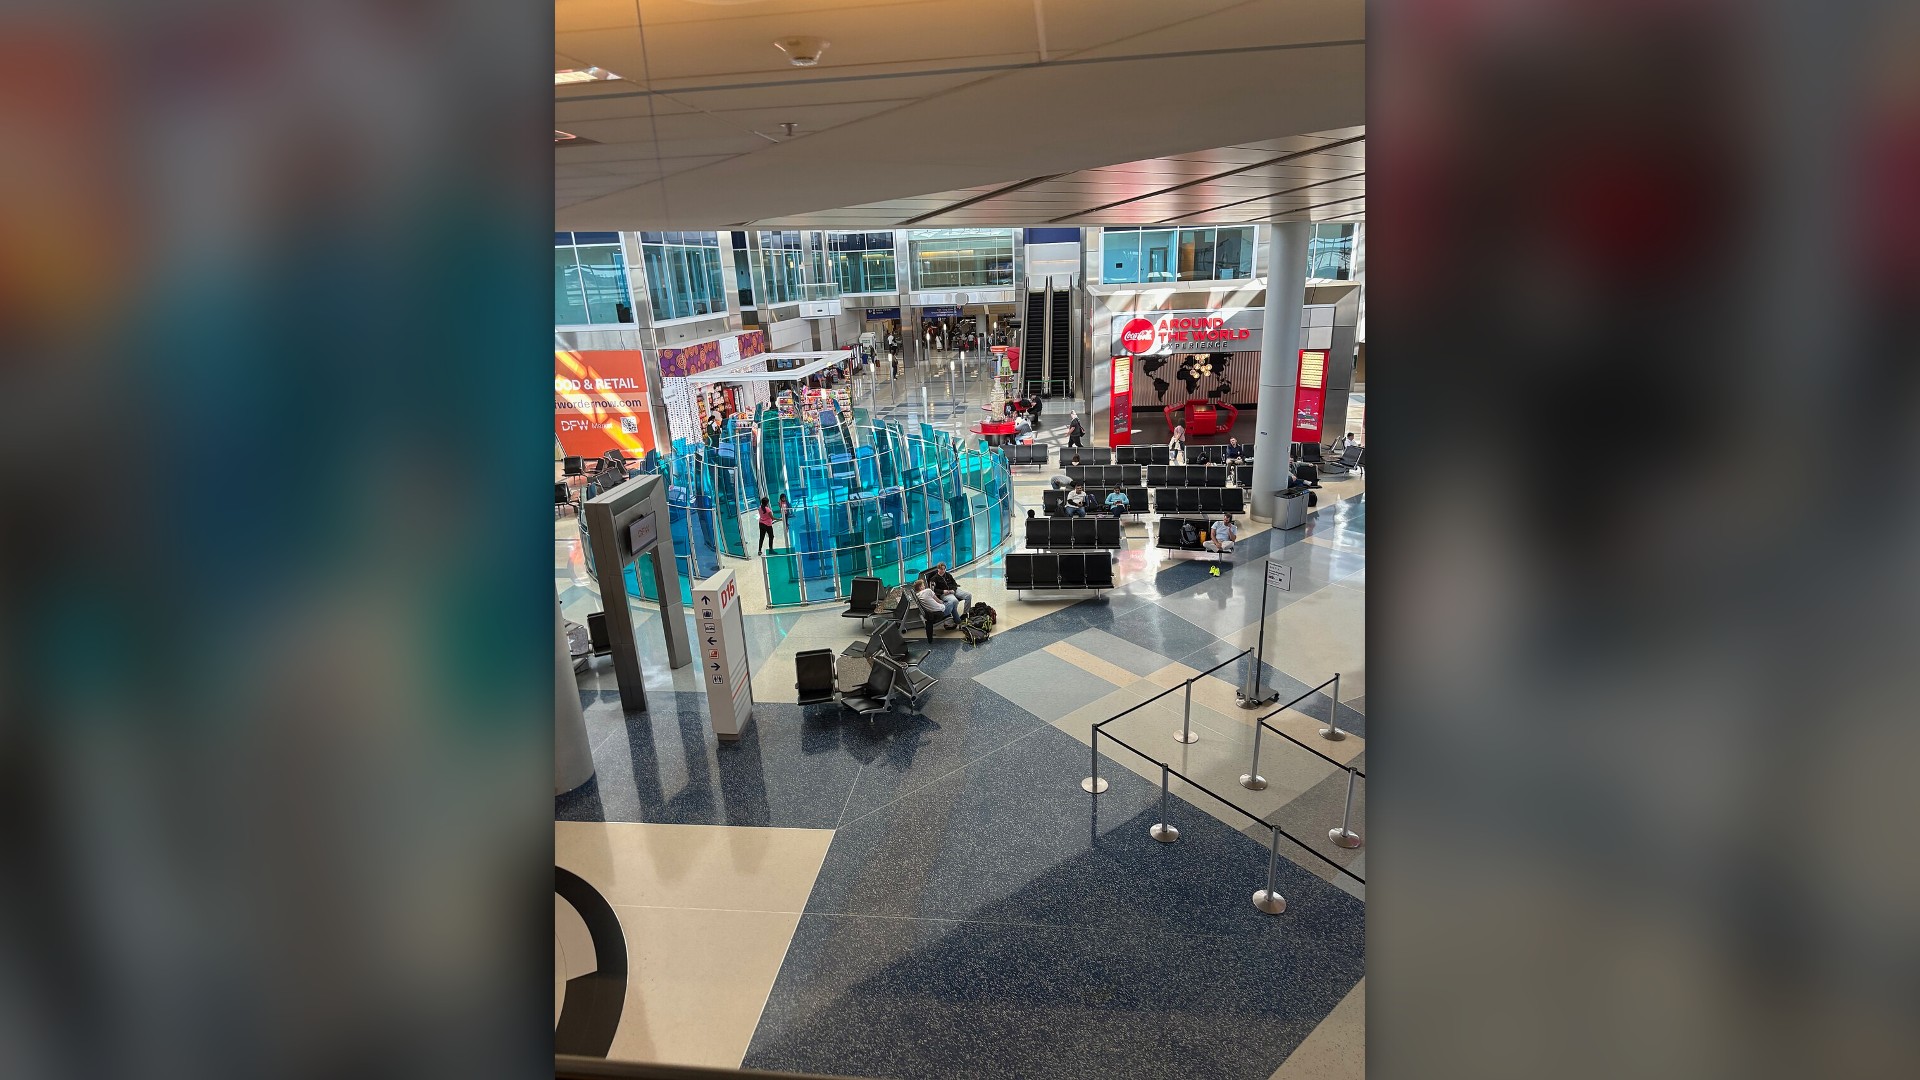
8. Dallas/Fort Worth International (DFW)
Spanning more land area than the island of Manhattan, DFW handles relentless daily traffic as American Airlines' primary fortress hub. Massive Texas spring supercells and hail storms regularly ground hundreds of connecting flights.
©Wikimedia / Chew
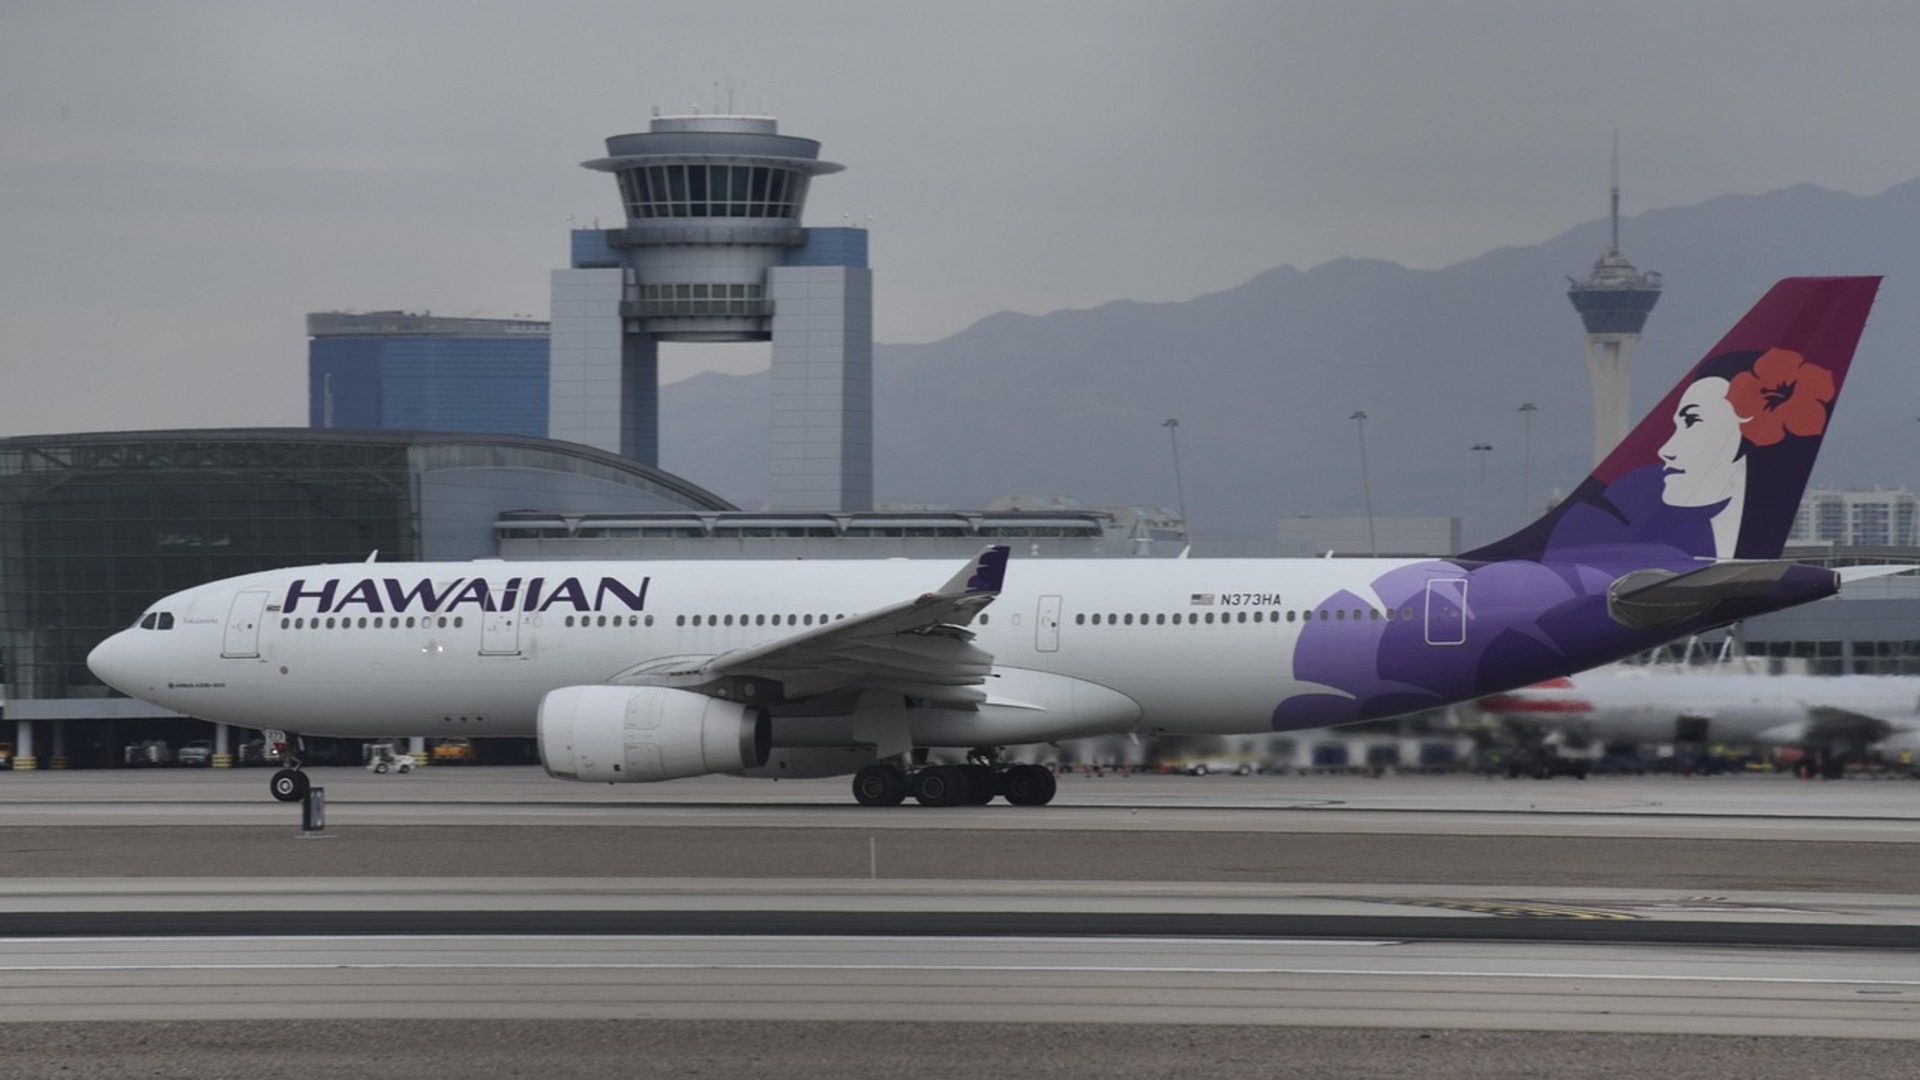
7. Las Vegas Harry Reid International (LAS)
Vegas visitors often face airport delays before their getaway begins. Extreme desert runway heat in summer and wind shear across surrounding mountain ranges combine to hold back roughly 25 percent of incoming and outgoing flights.
©Pixabay / jersnav
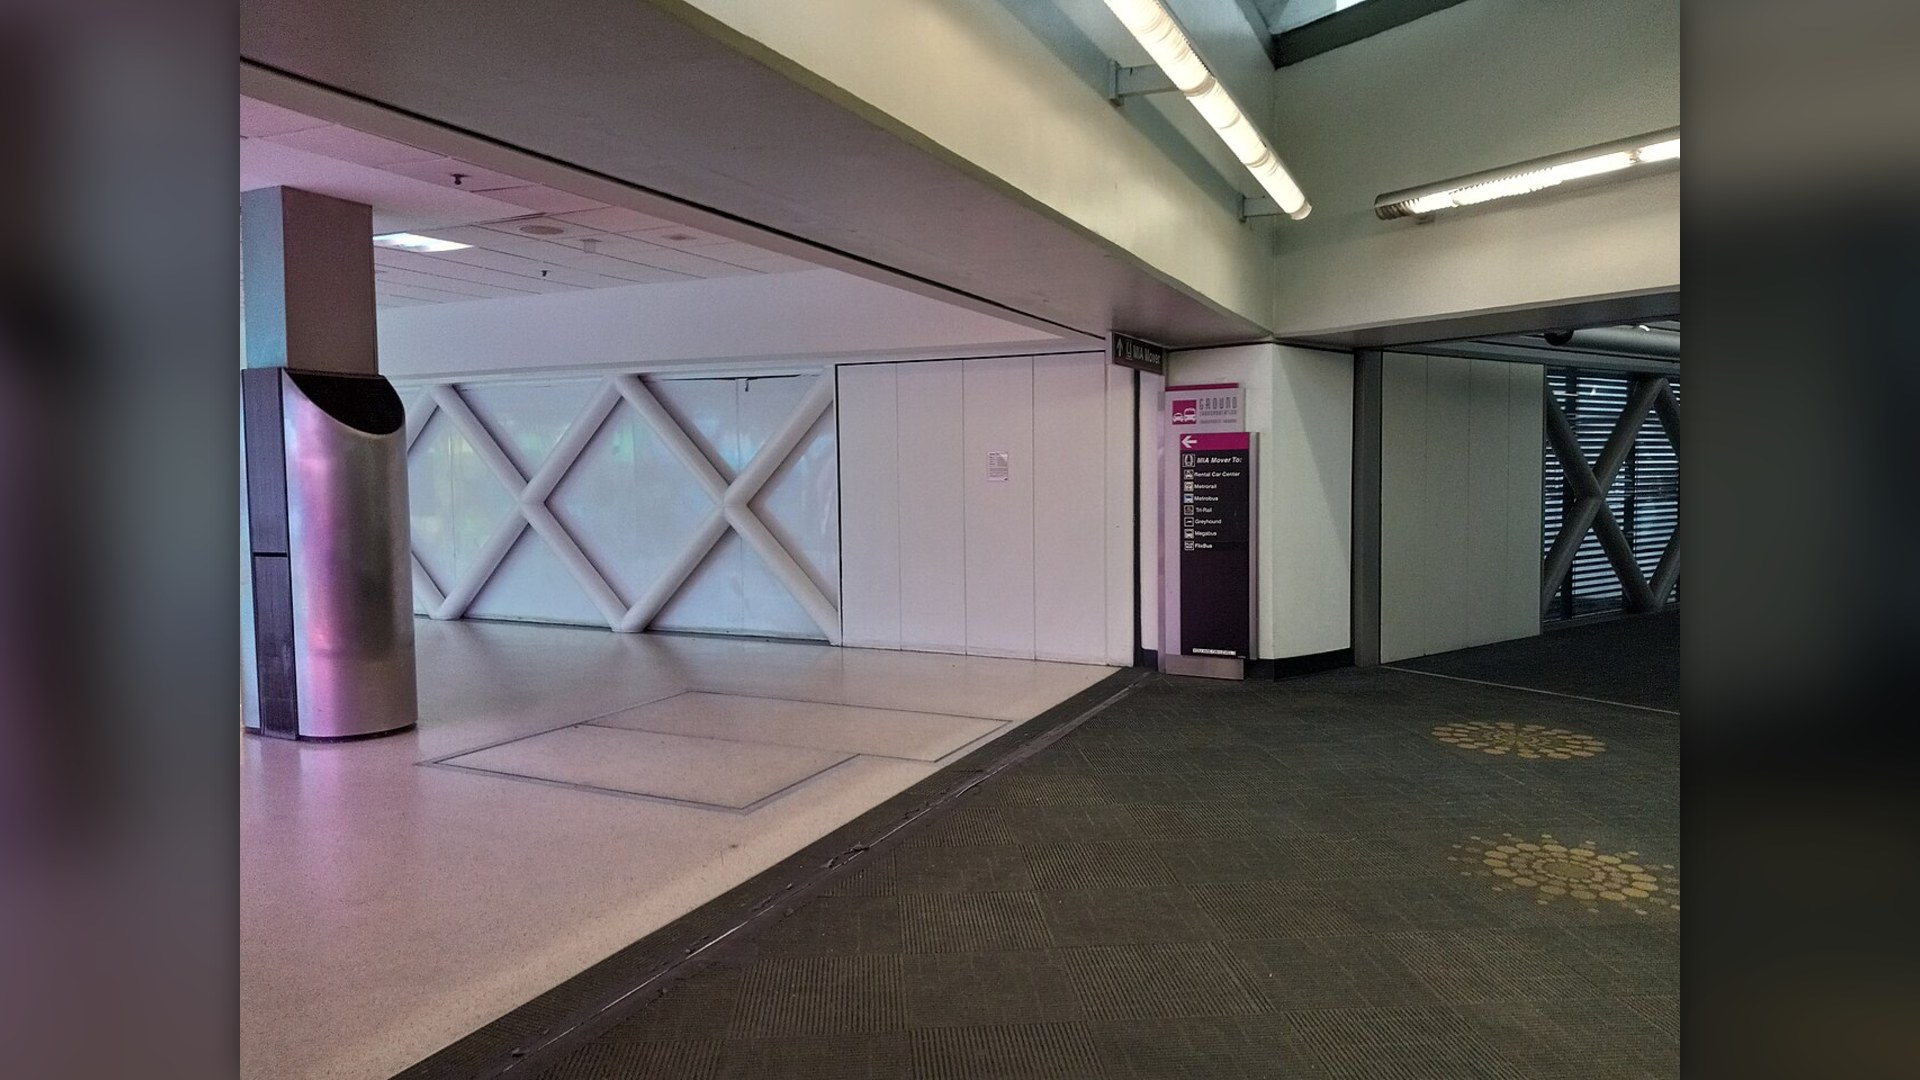
6. Miami International (MIA)
Miami serves as America's premier gateway to Latin America and the Caribbean, handling enormous cargo and passenger volume. Intense afternoon tropical downpours and lightning strikes push delay rates to 25 percent.
©Wikimedia Commons / FunctioningMemberOfSociety
5. Baltimore/Washington International (BWI)
Serving as a major budget transit hub for the Mid-Atlantic, BWI experiences heavy rolling delays whenever weather snarls the Northeast corridor. Packed single-concourse turns and de-icing queues push delays past 25 percent.
©Wikimedia Commons / Sunil Gupta
Advertisement
Swipe or tap ▶ to resume the countdown.
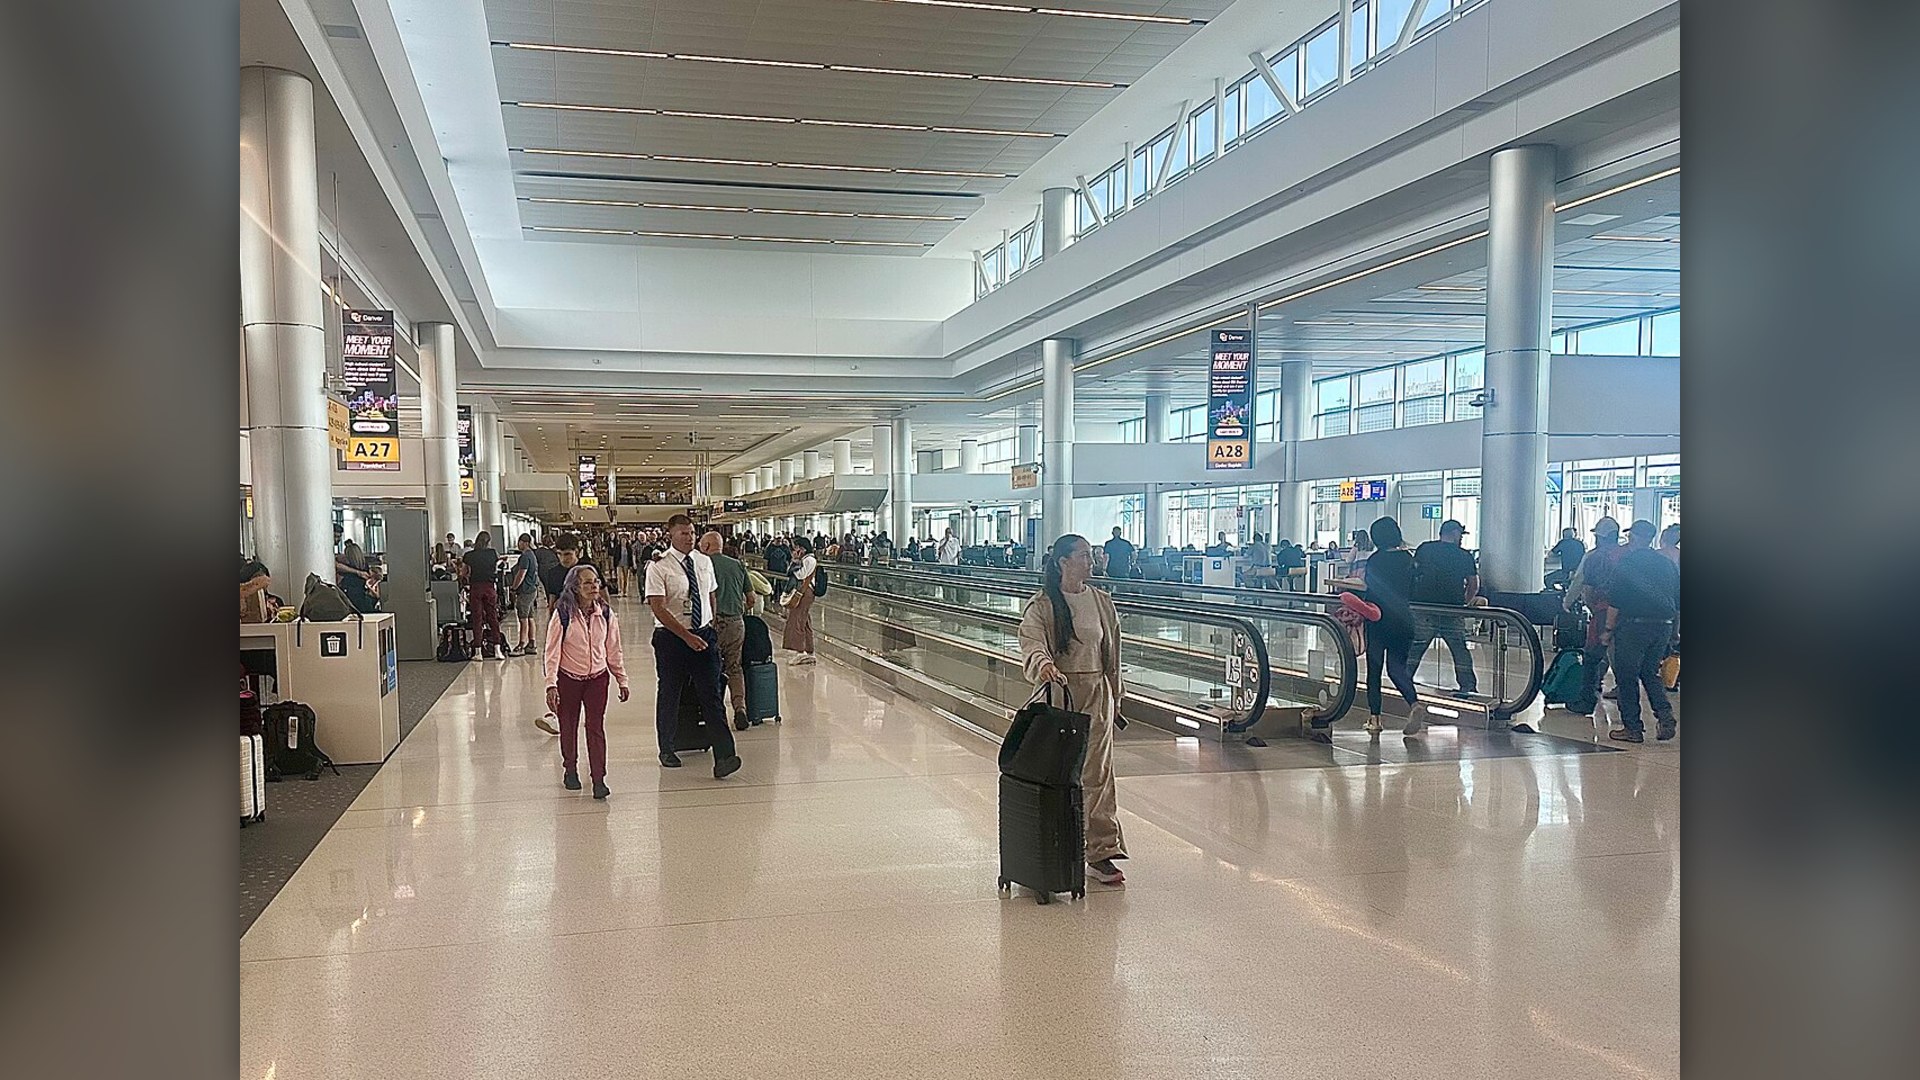
4. Denver International (DEN)
Denver's expansive mile-high runway layout provides high capacity, but Rocky Mountain winter blizzards bring severe challenges. De-icing operations, high-altitude wind shear, and summer mountain storms delay nearly 26 percent of all flights.
©Wikimedia Commons / Richard N Horne
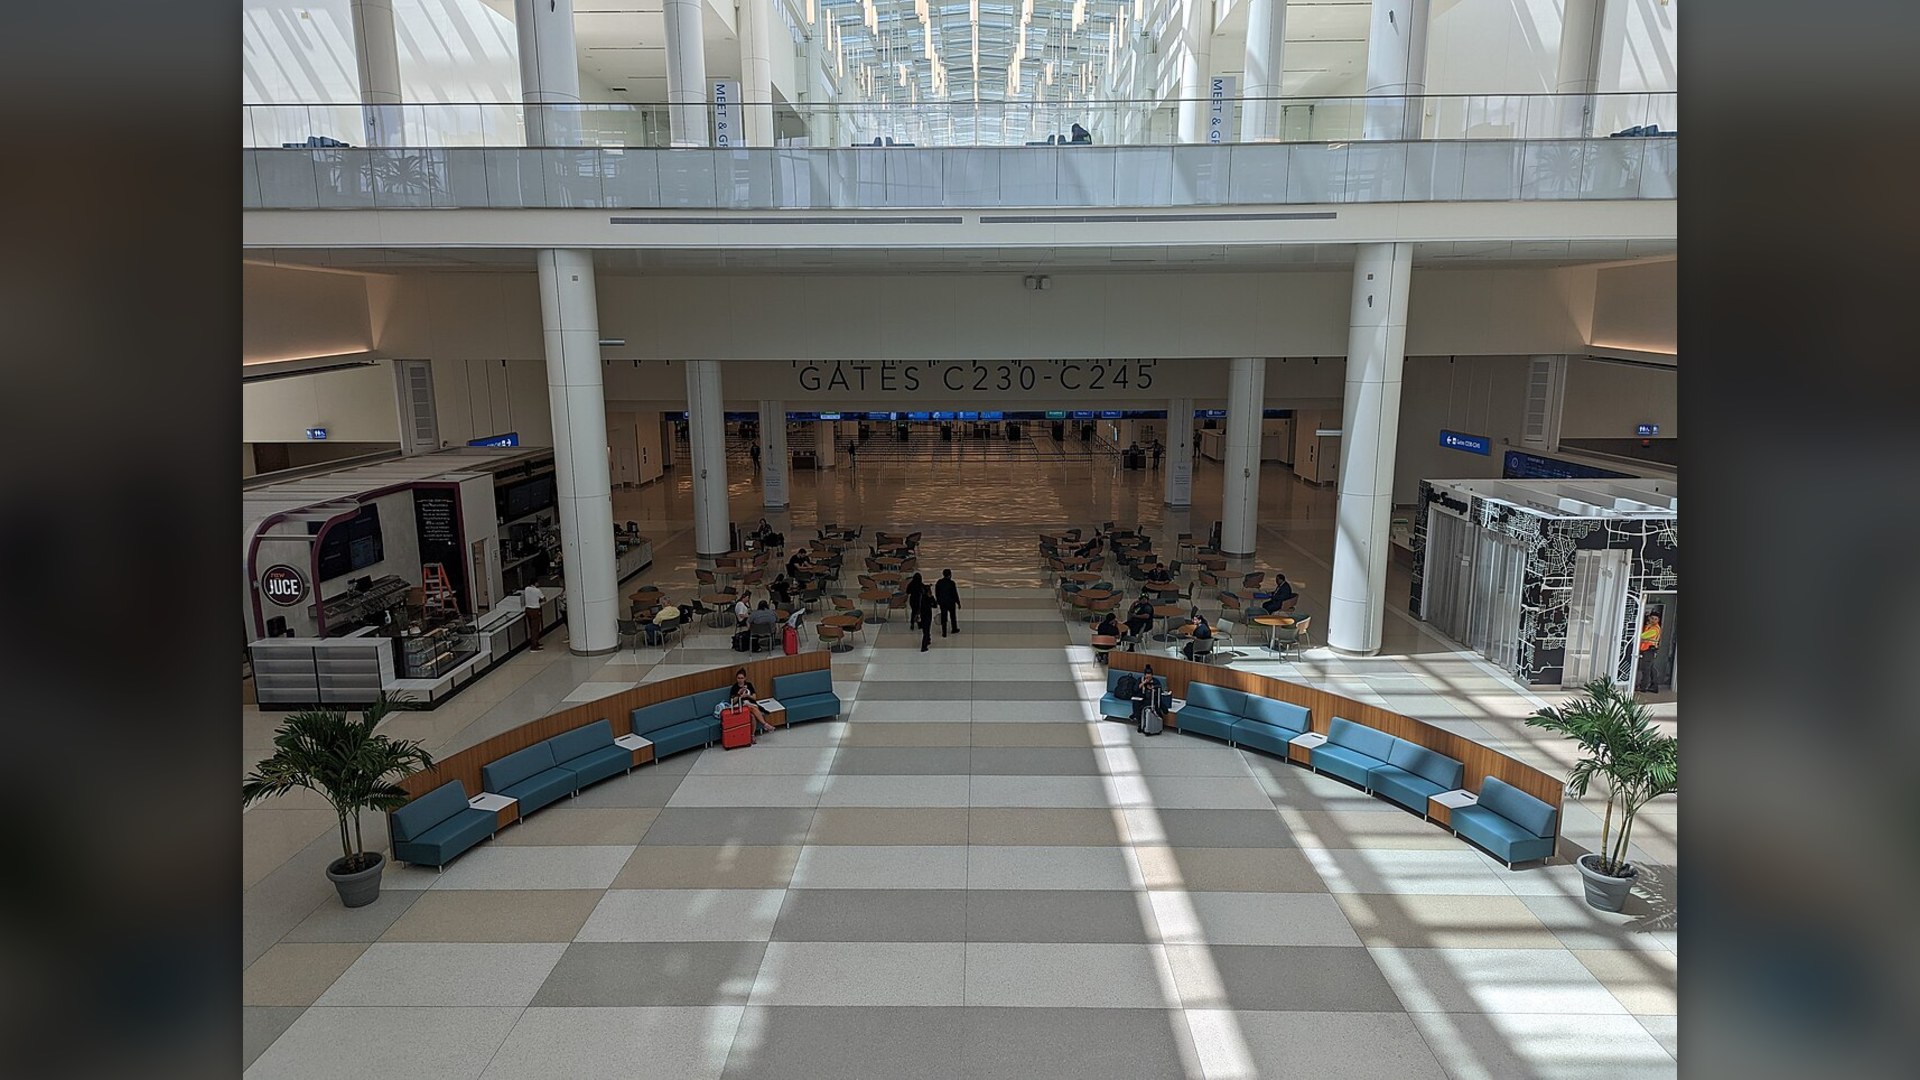
3. Orlando International (MCO)
Central Florida holds the title for America's lightning capital, meaning summer ramp closures occur almost daily at Orlando International. Combined with massive vacation crowd volume, over 26 percent of travelers encounter flight delays.
©Wikimedia Commons / elisfkc2
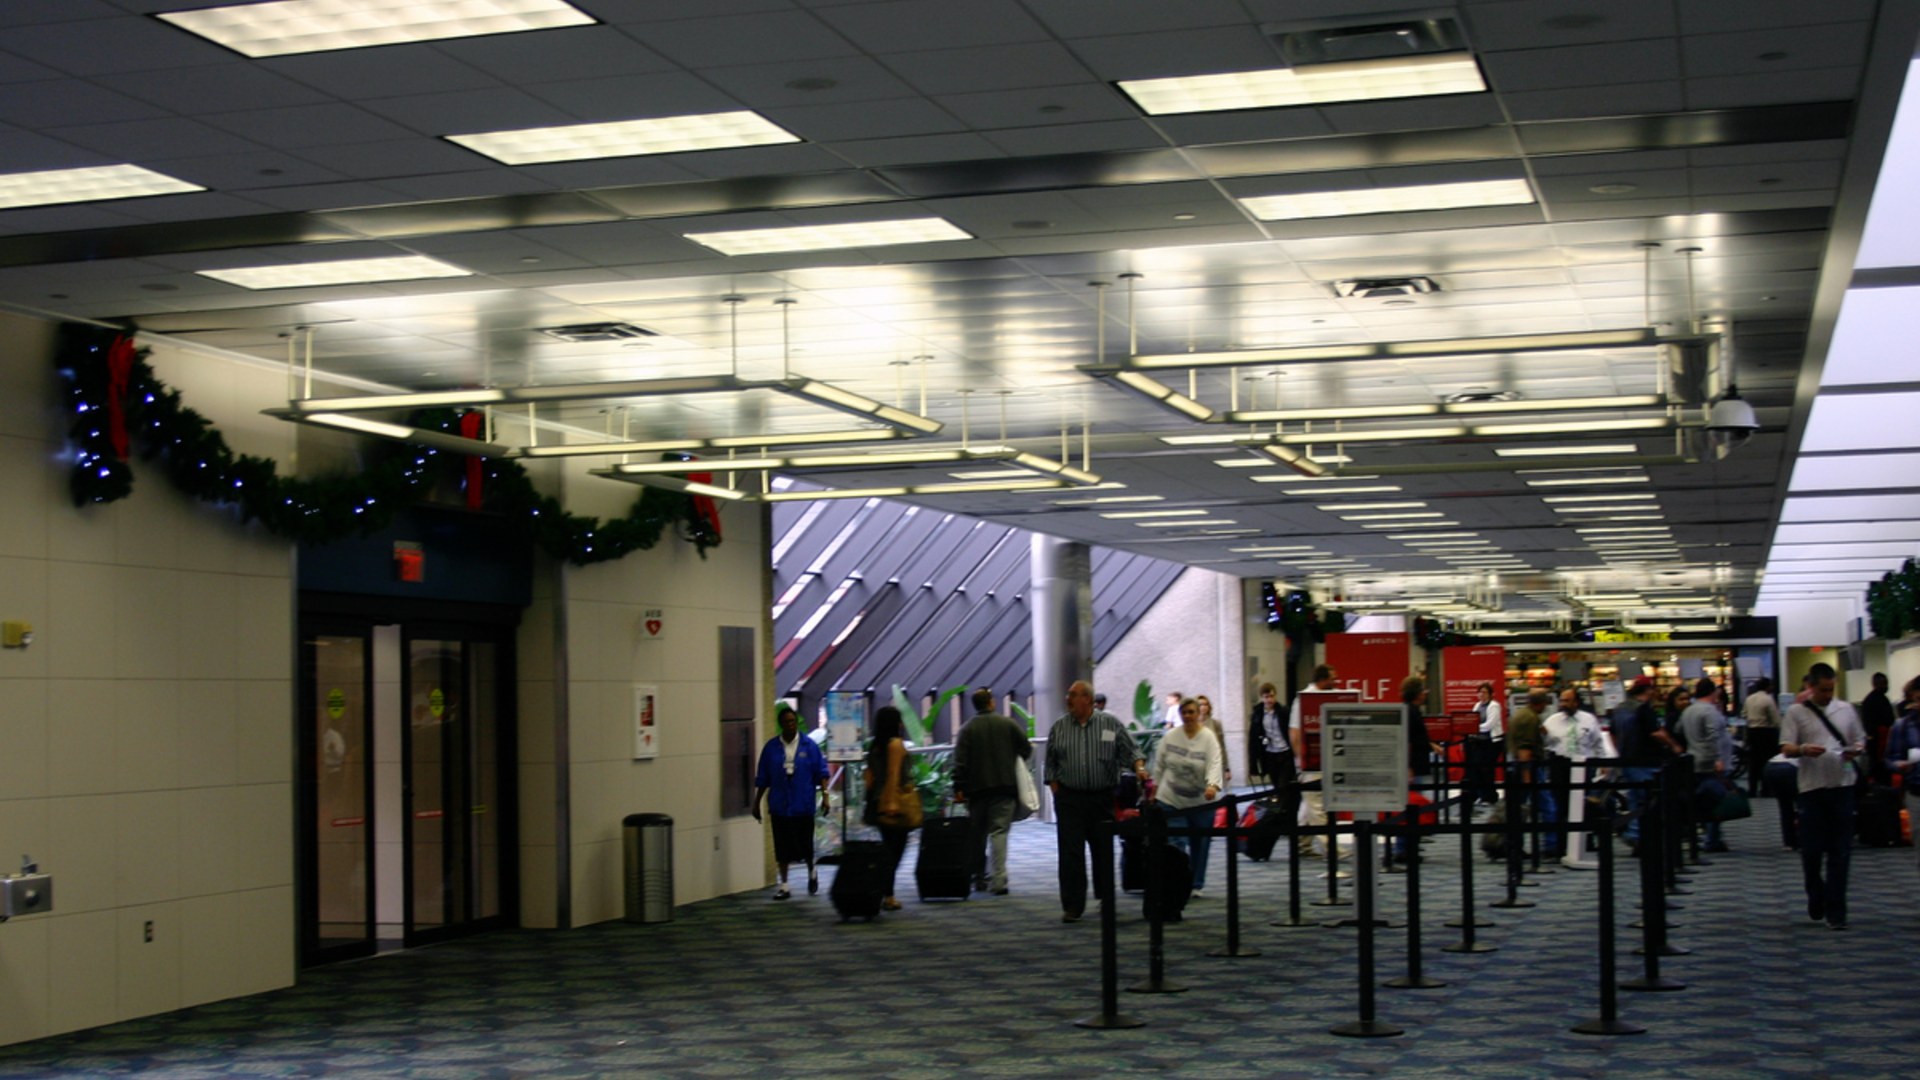
2. Fort Lauderdale-Hollywood (FLL)
Fort Lauderdale serves as a key base for low-cost carriers with tight turnaround windows. When tropical cloudbursts and localized ramp flash flooding hit, schedule recovery is difficult, leaving 27 percent of flights behind schedule.
©Wikimedia Commons / formulanone from Huntsville
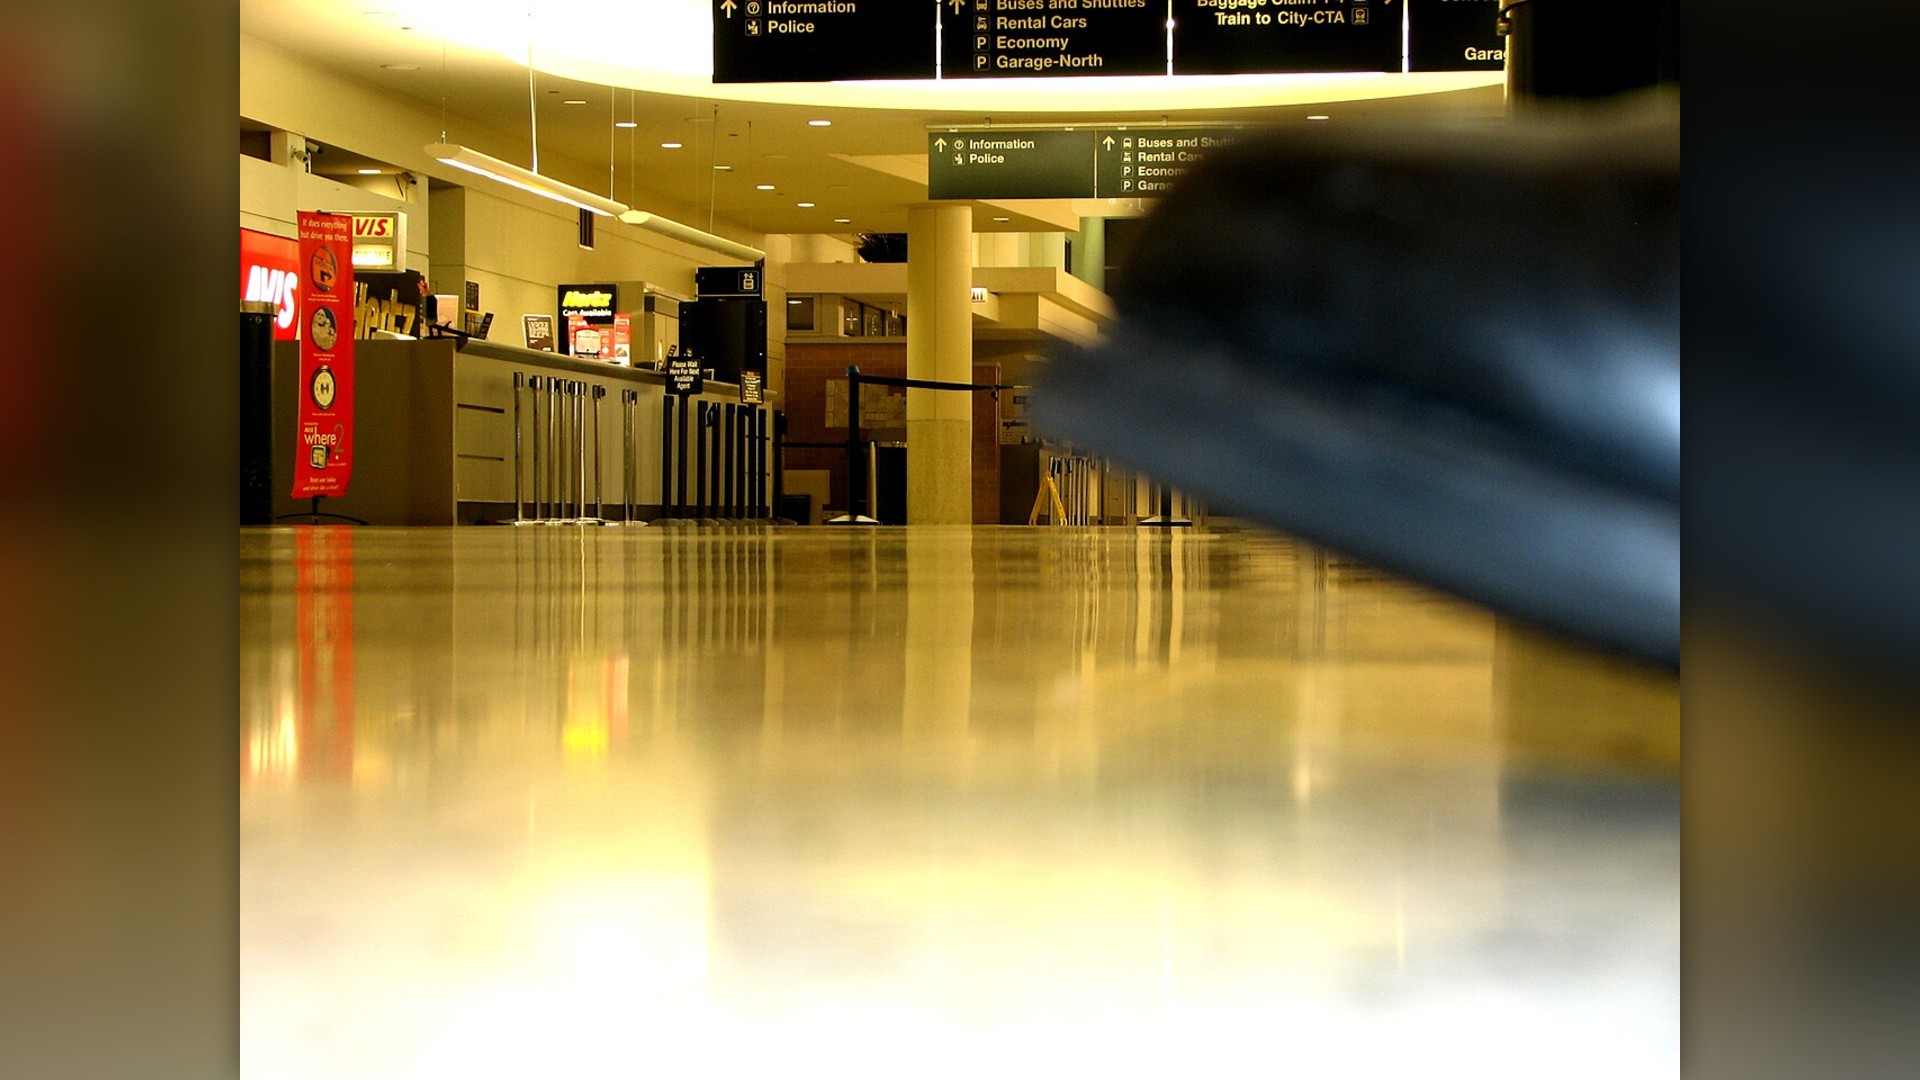
1. Chicago Midway International (MDW)
Topping national delay rankings, Chicago Midway operates within a dense one-square-mile airfield footprint dominated by Southwest Airlines. Winter snow squalls, short runways, and cascading network delays result in nearly 28 percent of flights suffering delays.
©NPS-NOAA-USGS / Humberto, Mex.
Advertisement
You've reached the end of the story. Thanks for reading!

25 Most Welcoming US States Ranked by Hospitality
Which American State Truly Treats Strangers Like Family
All 23 Entries in this Story
23. Austin-Bergstrom International (AUS)
Surging passenger growth across Texas tech corridors pushed Austin-Bergstrom into heavy runway holds. Recent terminal expansions aim to ease gate bottlenecks, but peak-hour flight surges still leave around 20 percent of travelers waiting on the tarmac.

22. Tampa International (TPA)
Tampa boasts one of America's most passenger-friendly terminal designs, but summer weather remains an unavoidable hurdle. Gulf Coast thunderstorm cells frequently force FAA ramp ground stops, impacting roughly 20 percent of afternoon departures.

21. San Diego International (SAN)
Operating as the nation's busiest single-runway commercial airfield, San Diego leaves zero room for operational error. Dense arrival sequencing and downtown terrain constraints mean minor morning fog easily ripples into evening schedule delays.

20. Phoenix Sky Harbor (PHX)
Desert heat routinely forces performance weight calculations during summer afternoons when thin air limits jet lift. Combined with busy regional connecting banks, roughly 21 percent of flights experience schedule setbacks.

19. Seattle-Tacoma International (SEA)
Squeezed between Puget Sound and the Cascade Mountains, Sea-Tac contends with persistent winter overcast ceilings and crowded taxiways. Growing international traffic creates gate holds that delay over 21 percent of flights.

18. Chicago O'Hare International (ORD)
O'Hare modernized its airfield into parallel runways, drastically improving flow, but harsh Lake Michigan snowstorms remain relentless. Extensive winter de-icing queues and severe crosswinds push 22 percent of flights behind schedule.

17. Philadelphia International (PHL)
Bordering dense New York and Washington air corridors, Philadelphia aircraft regularly face air traffic control spacing restrictions. Convective summer squalls and winter coastal rain push delay rates above 22 percent.

16. Hartsfield-Jackson Atlanta (ATL)
Handling over one hundred million passengers annually, Atlanta runs like clockwork until weather hits. Afternoon thunderstorms across the Southeast quickly trigger rolling ground stops across Delta's sprawling multi-concourse fortress hub.

15. Los Angeles International (LAX)
Heavy morning marine fog rolling off the Pacific frequently limits visual approaches to Southern California's primary gateway. Combined with extensive airfield construction and packed gates, nearly 23 percent of flights encounter holds.

14. Charlotte Douglas International (CLT)
Charlotte functions as a vital East Coast connecting hub for American Airlines, scheduling massive waves of arriving and departing jets within tight windows. When summer weather sweeps across the Carolinas, delay rates climb past 23 percent.

13. Houston George Bush Intercontinental (IAH)
Severe convective squall lines rolling in from the Gulf of Mexico regularly pause ground operations in Houston. Heavy international customs arrival banks and United connection holds push delay rates near 23 percent.

12. San Francisco International (SFO)
San Francisco's closely spaced parallel runways require clear visual conditions to operate at maximum arrival volume. Whenever thick Pacific fog rolls across the bay, incoming flight capacity drops dramatically, sparking nationwide ripple delays.

11. John F. Kennedy International (JFK)
Navigating New York's heavily saturated airspace alongside intense international wide-body scheduling makes JFK vulnerable to ground delays. Passing Atlantic squalls frequently leave 23 percent of passengers waiting on taxiways.

10. Boston Logan International (BOS)
Perched along Boston Harbor, Logan airport absorbs the full brunt of Atlantic Nor'easters and freezing ocean winds. Tight runway layouts and congested Northeast air corridors lead to delays on nearly 24 percent of flights.

9. Newark Liberty International (EWR)
Sharing airspace with JFK and LaGuardia leaves Newark with zero room for weather disruptions. Air traffic control staffing constraints and runway congestion regularly push delay numbers above 24 percent.

8. Dallas/Fort Worth International (DFW)
Spanning more land area than the island of Manhattan, DFW handles relentless daily traffic as American Airlines' primary fortress hub. Massive Texas spring supercells and hail storms regularly ground hundreds of connecting flights.

7. Las Vegas Harry Reid International (LAS)
Vegas visitors often face airport delays before their getaway begins. Extreme desert runway heat in summer and wind shear across surrounding mountain ranges combine to hold back roughly 25 percent of incoming and outgoing flights.

6. Miami International (MIA)
Miami serves as America's premier gateway to Latin America and the Caribbean, handling enormous cargo and passenger volume. Intense afternoon tropical downpours and lightning strikes push delay rates to 25 percent.

5. Baltimore/Washington International (BWI)
Serving as a major budget transit hub for the Mid-Atlantic, BWI experiences heavy rolling delays whenever weather snarls the Northeast corridor. Packed single-concourse turns and de-icing queues push delays past 25 percent.

4. Denver International (DEN)
Denver's expansive mile-high runway layout provides high capacity, but Rocky Mountain winter blizzards bring severe challenges. De-icing operations, high-altitude wind shear, and summer mountain storms delay nearly 26 percent of all flights.

3. Orlando International (MCO)
Central Florida holds the title for America's lightning capital, meaning summer ramp closures occur almost daily at Orlando International. Combined with massive vacation crowd volume, over 26 percent of travelers encounter flight delays.

2. Fort Lauderdale-Hollywood (FLL)
Fort Lauderdale serves as a key base for low-cost carriers with tight turnaround windows. When tropical cloudbursts and localized ramp flash flooding hit, schedule recovery is difficult, leaving 27 percent of flights behind schedule.

1. Chicago Midway International (MDW)
Topping national delay rankings, Chicago Midway operates within a dense one-square-mile airfield footprint dominated by Southwest Airlines. Winter snow squalls, short runways, and cascading network delays result in nearly 28 percent of flights suffering delays.